| Tabulation of Results | ||||
| EP1 x TVDC3 | ||||
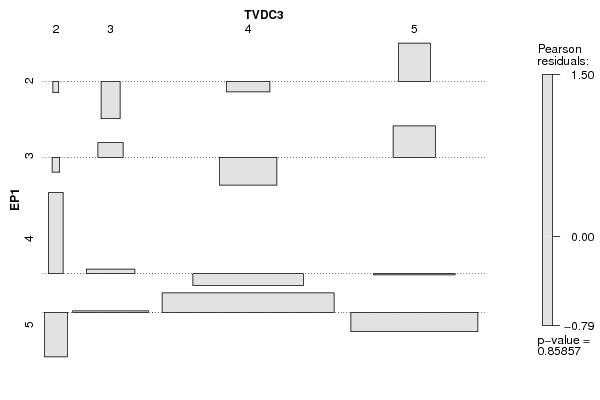
| 2 | 3 | 4 | 5 | 2 | 0 | 0 | 2 | 2 | 3 | 0 | 1 | 3 | 3 | 4 | 1 | 3 | 14 | 8 | 5 | 0 | 7 | 38 | 18 |
| Tabulation of Expected Results | ||||
| EP1 x TVDC3 | ||||
| 2 | 3 | 4 | 5 | 2 | 0.04 | 0.44 | 2.28 | 1.24 | 3 | 0.07 | 0.77 | 3.99 | 2.17 | 4 | 0.26 | 2.86 | 14.82 | 8.06 | 5 | 0.63 | 6.93 | 35.91 | 19.53 |
| Statistical Results | |
| Pearson's Chi-squared test with simulated p-value (based on 2000 replicates) | |
| Exact Pearson Chi Square Statistic | 4.71 |
| P value | 0.79 |