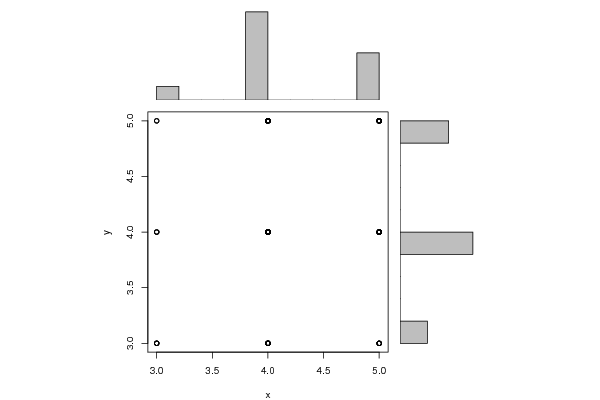
| Pearson Product Moment Correlation - Ungrouped Data | ||
| Statistic | Variable X | Variable Y |
| Mean | 4.22448979591837 | 4.14285714285714 |
| Biased Variance | 0.357767596834652 | 0.489795918367347 |
| Biased Standard Deviation | 0.59813677101032 | 0.699854212223765 |
| Covariance | 0.0706921944035346 | |
| Correlation | 0.16715102301092 | |
| Determination | 0.0279394644935972 | |
| T-Test | 1.66110849649436 | |
| p-value (2 sided) | 0.0999542755522147 | |
| p-value (1 sided) | 0.0499771377761074 | |
| 95% CI of Correlation | [-0.0323424229256188, 0.353836372417072] | |
| Degrees of Freedom | 96 | |
| Number of Observations | 98 | |
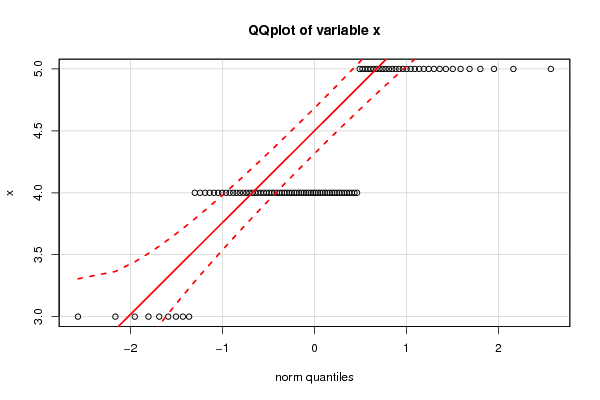
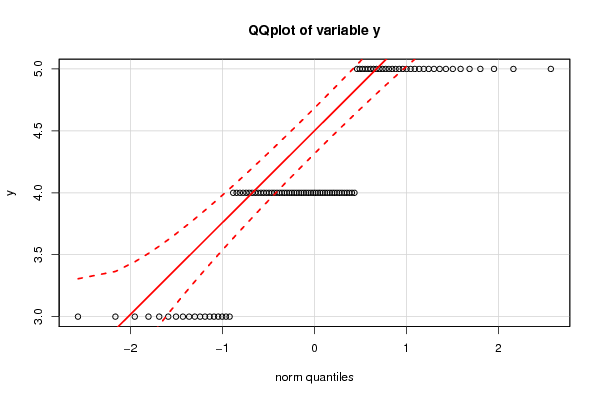
| Normality Tests |
> jarque.x Jarque-Bera Normality Test data: x JB = 1.2212, p-value = 0.543 alternative hypothesis: greater |
> jarque.y Jarque-Bera Normality Test data: y JB = 4.4307, p-value = 0.1091 alternative hypothesis: greater |
> ad.x Anderson-Darling normality test data: x A = 11.434, p-value < 2.2e-16 |
> ad.y Anderson-Darling normality test data: y A = 8.3446, p-value < 2.2e-16 |