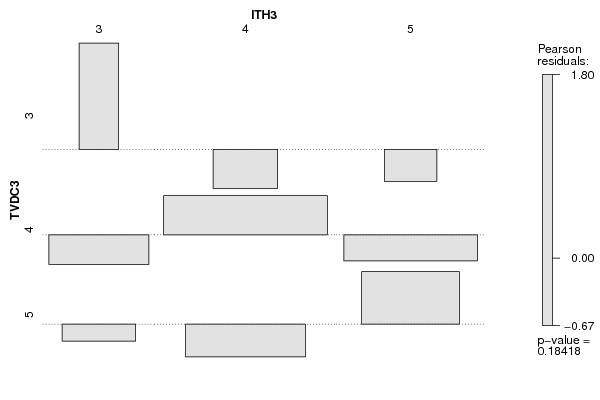
| Tabulation of Results | |||
| TVDC3 x ITH3 | |||
| 3 | 4 | 5 | 3 | 4 | 3 | 2 | 4 | 9 | 32 | 17 | 5 | 5 | 13 | 13 |
| Tabulation of Expected Results | |||
| TVDC3 x ITH3 | |||
| 3 | 4 | 5 | 3 | 1.65 | 4.41 | 2.94 | 4 | 10.65 | 28.41 | 18.94 | 5 | 5.69 | 15.18 | 10.12 |
| Statistical Results | |
| Pearson's Chi-squared test with simulated p-value (based on 2000 replicates) | |
| Exact Pearson Chi Square Statistic | 6.21 |
| P value | 0.18 |