| Multiple Linear Regression - Estimated Regression Equation |
| Per_Capita_Income[t] = + 1131.86 -1652.48Prop_Population_on_Farms[t] -2.47251HIV_Risk[t] + e[t] |
| Multiple Linear Regression - Ordinary Least Squares | |||||
| Variable | Parameter | S.D. | T-STAT H0: parameter = 0 | 2-tail p-value | 1-tail p-value |
| (Intercept) | +1132 | 134.9 | +8.3870e+00 | 5.352e-09 | 2.676e-09 |
| Prop_Population_on_Farms | -1652 | 305.6 | -5.4070e+00 | 1.024e-05 | 5.119e-06 |
| HIV_Risk | -2.473 | 5.642 | -4.3830e-01 | 0.6647 | 0.3323 |
| Multiple Linear Regression - Regression Statistics | |
| Multiple R | 0.7773 |
| R-squared | 0.6042 |
| Adjusted R-squared | 0.5748 |
| F-TEST (value) | 20.61 |
| F-TEST (DF numerator) | 2 |
| F-TEST (DF denominator) | 27 |
| p-value | 3.685e-06 |
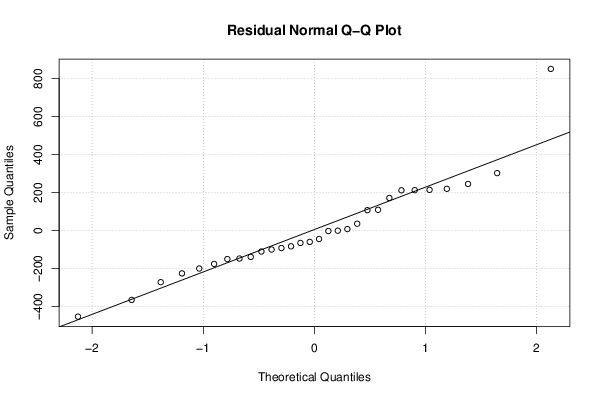
| Multiple Linear Regression - Residual Statistics | |
| Residual Standard Deviation | 255.2 |
| Sum Squared Residuals | 1.758e+06 |
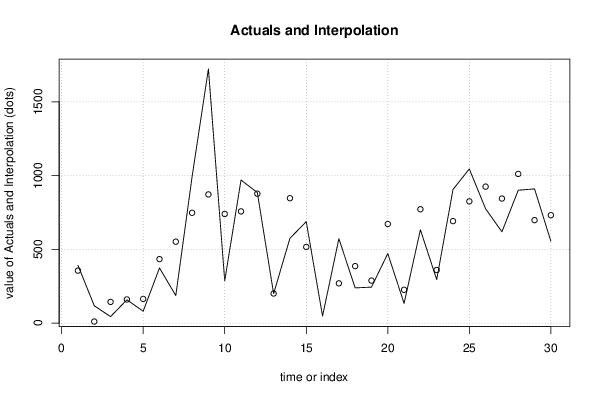
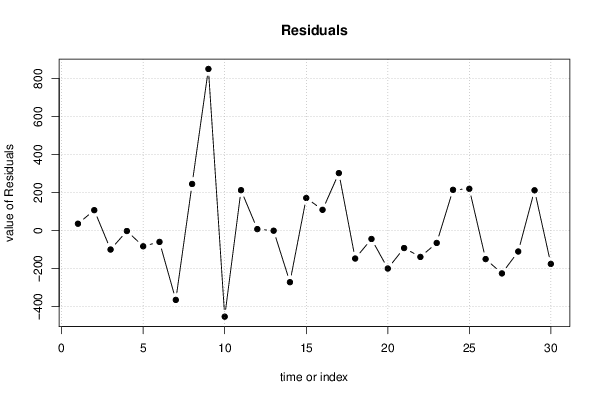
| Multiple Linear Regression - Actuals, Interpolation, and Residuals | |||
| Time or Index | Actuals | Interpolation Forecast | Residuals Prediction Error |
| 1 | 392 | 356.1 | 35.86 |
| 2 | 118 | 10.85 | 107.2 |
| 3 | 44 | 144 | -100 |
| 4 | 158 | 160.6 | -2.604 |
| 5 | 81 | 164.1 | -83.07 |
| 6 | 374 | 433.9 | -59.9 |
| 7 | 187 | 552 | -365 |
| 8 | 993 | 747.9 | 245.1 |
| 9 | 1723 | 872.5 | 850.5 |
| 10 | 287 | 740.3 | -453.3 |
| 11 | 970 | 757.6 | 212.4 |
| 12 | 885 | 877.4 | 7.565 |
| 13 | 200 | 200.9 | -0.9057 |
| 14 | 575 | 846.9 | -271.9 |
| 15 | 688 | 516.6 | 171.4 |
| 16 | 48 | -61.02 | 109 |
| 17 | 572 | 269.7 | 302.3 |
| 18 | 239 | 386.4 | -147.4 |
| 19 | 244 | 288.5 | -44.47 |
| 20 | 472 | 672 | -200 |
| 21 | 134 | 226.1 | -92.08 |
| 22 | 633 | 771.9 | -138.9 |
| 23 | 295 | 360.3 | -65.26 |
| 24 | 906 | 691.7 | 214.3 |
| 25 | 1045 | 825.4 | 219.6 |
| 26 | 775 | 925.3 | -150.3 |
| 27 | 619 | 844.7 | -225.7 |
| 28 | 901 | 1011 | -110.4 |
| 29 | 910 | 698.2 | 211.8 |
| 30 | 556 | 731.7 | -175.7 |
| Goldfeld-Quandt test for Heteroskedasticity | |||
| p-values | Alternative Hypothesis | ||
| breakpoint index | greater | 2-sided | less |
| 6 | 0.03778 | 0.07556 | 0.9622 |
| 7 | 0.06267 | 0.1253 | 0.9373 |
| 8 | 0.2857 | 0.5713 | 0.7143 |
| 9 | 0.9411 | 0.1177 | 0.05886 |
| 10 | 0.9952 | 0.009611 | 0.004806 |
| 11 | 0.993 | 0.01396 | 0.006981 |
| 12 | 0.9873 | 0.02545 | 0.01273 |
| 13 | 0.975 | 0.05009 | 0.02505 |
| 14 | 0.9773 | 0.04549 | 0.02274 |
| 15 | 0.9663 | 0.06736 | 0.03368 |
| 16 | 0.9392 | 0.1217 | 0.06084 |
| 17 | 0.9635 | 0.07294 | 0.03647 |
| 18 | 0.9381 | 0.1237 | 0.06187 |
| 19 | 0.8884 | 0.2231 | 0.1116 |
| 20 | 0.8486 | 0.3028 | 0.1514 |
| 21 | 0.7734 | 0.4532 | 0.2266 |
| 22 | 0.6972 | 0.6055 | 0.3028 |
| 23 | 0.7493 | 0.5013 | 0.2507 |
| 24 | 0.5887 | 0.8227 | 0.4113 |
| Meta Analysis of Goldfeld-Quandt test for Heteroskedasticity | |||
| Description | # significant tests | % significant tests | OK/NOK |
| 1% type I error level | 1 | 0.05263 | NOK |
| 5% type I error level | 4 | 0.210526 | NOK |
| 10% type I error level | 8 | 0.421053 | NOK |