| Tabulation of Results | ||
| Gender x Risk | ||
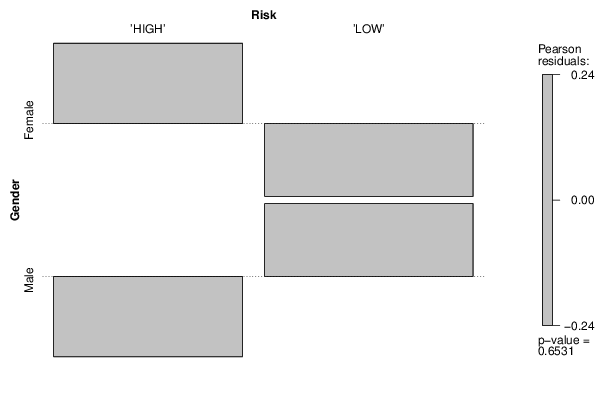
| 'HIGH' | 'LOW' | Female | 5 | 5 | Male | 4 | 6 |
| Tabulation of Expected Results | ||
| Gender x Risk | ||
| 'HIGH' | 'LOW' | Female | 4.5 | 5.5 | Male | 4.5 | 5.5 |
| Statistical Results | |
| Pearson's Chi-squared test with Yates' continuity correction | |
| Pearson Chi Square Statistic | 0 |
| Degrees of Freedom | 1 |
| P value | 1 |