| Multiple Linear Regression - Estimated Regression Equation |
| Geslacht[t] = -0.46296 -0.105167Drugs[t] -0.0314728Fruit[t] + 0.177369Sport[t] -0.155176Alcohol[t] + 0.298309Gebgewicht[t] + e[t] |
| Multiple Linear Regression - Ordinary Least Squares | |||||
| Variable | Parameter | S.D. | T-STAT H0: parameter = 0 | 2-tail p-value | 1-tail p-value |
| (Intercept) | -0.463 | 1.196 | -3.8710e-01 | 0.7045 | 0.3523 |
| Drugs | -0.1052 | 0.3431 | -3.0650e-01 | 0.7637 | 0.3819 |
| Fruit | -0.03147 | 0.2977 | -1.0570e-01 | 0.9173 | 0.4587 |
| Sport | +0.1774 | 0.3029 | +5.8550e-01 | 0.5675 | 0.2838 |
| Alcohol | -0.1552 | 0.313 | -4.9580e-01 | 0.6277 | 0.3139 |
| Gebgewicht | +0.2983 | 0.3493 | +8.5400e-01 | 0.4075 | 0.2037 |
| Multiple Linear Regression - Regression Statistics | |
| Multiple R | 0.2846 |
| R-squared | 0.08098 |
| Adjusted R-squared | -0.2472 |
| F-TEST (value) | 0.2467 |
| F-TEST (DF numerator) | 5 |
| F-TEST (DF denominator) | 14 |
| p-value | 0.9346 |
| Multiple Linear Regression - Residual Statistics | |
| Residual Standard Deviation | 0.5729 |
| Sum Squared Residuals | 4.595 |
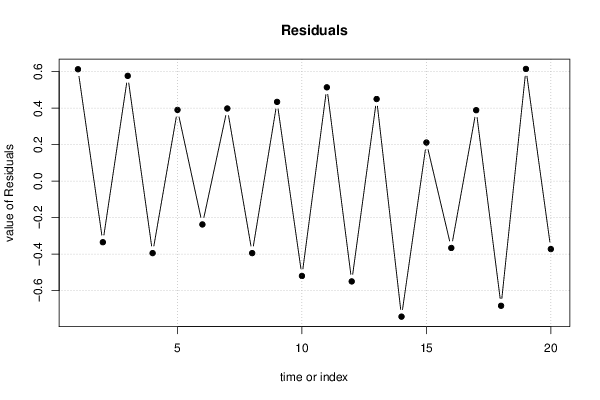
| Multiple Linear Regression - Actuals, Interpolation, and Residuals | |||
| Time or Index | Actuals | Interpolation Forecast | Residuals Prediction Error |
| 1 | 1 | 0.3865 | 0.6135 |
| 2 | 0 | 0.3348 | -0.3348 |
| 3 | 1 | 0.4227 | 0.5773 |
| 4 | 0 | 0.3945 | -0.3945 |
| 5 | 1 | 0.6093 | 0.3907 |
| 6 | 0 | 0.2373 | -0.2373 |
| 7 | 1 | 0.6017 | 0.3983 |
| 8 | 0 | 0.3945 | -0.3945 |
| 9 | 1 | 0.5654 | 0.4346 |
| 10 | 0 | 0.5198 | -0.5198 |
| 11 | 1 | 0.4856 | 0.5144 |
| 12 | 0 | 0.5496 | -0.5496 |
| 13 | 1 | 0.5497 | 0.4503 |
| 14 | 0 | 0.7428 | -0.7428 |
| 15 | 1 | 0.7883 | 0.2117 |
| 16 | 0 | 0.3663 | -0.3663 |
| 17 | 1 | 0.611 | 0.389 |
| 18 | 0 | 0.6832 | -0.6832 |
| 19 | 1 | 0.3848 | 0.6152 |
| 20 | 0 | 0.3723 | -0.3723 |