| Multiple Linear Regression - Estimated Regression Equation |
| Prop_Population_on_Farms[t] = + 0.406521 + 0.00348026HIV_Risk[t] -0.000314576Per_Capita_Income[t] + e[t] |
| Multiple Linear Regression - Ordinary Least Squares | |||||
| Variable | Parameter | S.D. | T-STAT H0: parameter = 0 | 2-tail p-value | 1-tail p-value |
| (Intercept) | +0.4065 | 0.07987 | +5.0900e+00 | 2.392e-05 | 1.196e-05 |
| HIV_Risk | +0.00348 | 0.002378 | +1.4640e+00 | 0.1548 | 0.07742 |
| Per_Capita_Income | -0.0003146 | 5.818e-05 | -5.4070e+00 | 1.024e-05 | 5.119e-06 |
| Multiple Linear Regression - Regression Statistics | |
| Multiple R | 0.7941 |
| R-squared | 0.6307 |
| Adjusted R-squared | 0.6033 |
| F-TEST (value) | 23.05 |
| F-TEST (DF numerator) | 2 |
| F-TEST (DF denominator) | 27 |
| p-value | 1.446e-06 |
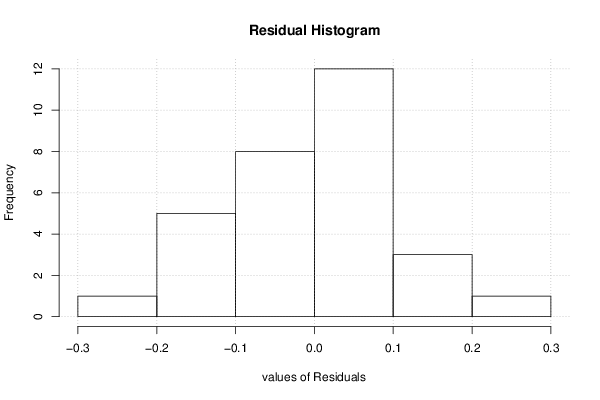
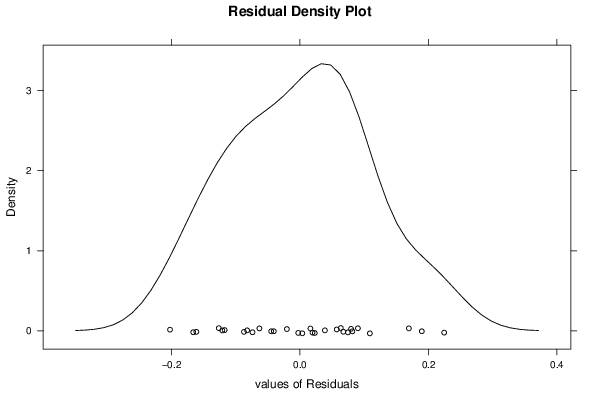
| Multiple Linear Regression - Residual Statistics | |
| Residual Standard Deviation | 0.1113 |
| Sum Squared Residuals | 0.3348 |
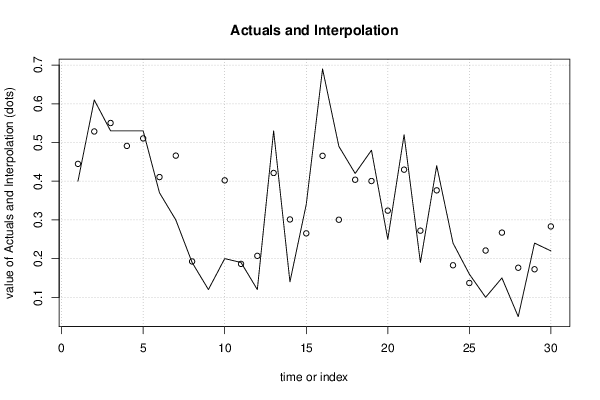
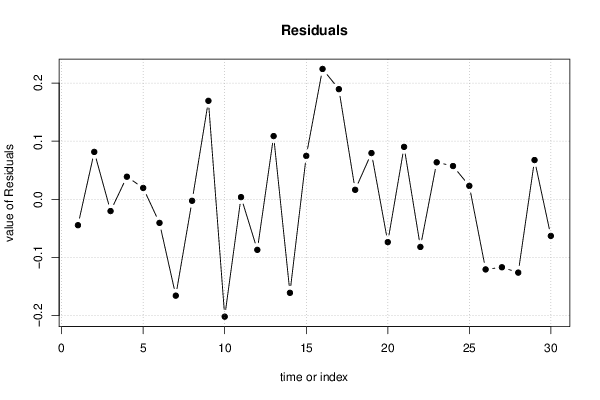
| Multiple Linear Regression - Actuals, Interpolation, and Residuals | |||
| Time or Index | Actuals | Interpolation Forecast | Residuals Prediction Error |
| 1 | 0.4 | 0.4447 | -0.04469 |
| 2 | 0.61 | 0.5284 | 0.08155 |
| 3 | 0.53 | 0.5503 | -0.02034 |
| 4 | 0.53 | 0.4912 | 0.03884 |
| 5 | 0.53 | 0.5105 | 0.01949 |
| 6 | 0.37 | 0.4107 | -0.04068 |
| 7 | 0.3 | 0.466 | -0.166 |
| 8 | 0.19 | 0.1926 | -0.002638 |
| 9 | 0.12 | -0.04953 | 0.1695 |
| 10 | 0.2 | 0.4022 | -0.2022 |
| 11 | 0.19 | 0.1863 | 0.003699 |
| 12 | 0.12 | 0.2071 | -0.08712 |
| 13 | 0.53 | 0.4212 | 0.1088 |
| 14 | 0.14 | 0.3012 | -0.1612 |
| 15 | 0.34 | 0.2653 | 0.07473 |
| 16 | 0.69 | 0.4656 | 0.2244 |
| 17 | 0.49 | 0.3004 | 0.1896 |
| 18 | 0.42 | 0.4037 | 0.01627 |
| 19 | 0.48 | 0.4004 | 0.07959 |
| 20 | 0.25 | 0.3238 | -0.07382 |
| 21 | 0.52 | 0.4298 | 0.0902 |
| 22 | 0.19 | 0.2721 | -0.08213 |
| 23 | 0.44 | 0.3764 | 0.06363 |
| 24 | 0.24 | 0.1828 | 0.05723 |
| 25 | 0.16 | 0.137 | 0.02305 |
| 26 | 0.1 | 0.2208 | -0.1208 |
| 27 | 0.15 | 0.2671 | -0.1171 |
| 28 | 0.05 | 0.1763 | -0.1263 |
| 29 | 0.24 | 0.1725 | 0.06754 |
| 30 | 0.22 | 0.2831 | -0.06312 |
| Goldfeld-Quandt test for Heteroskedasticity | |||
| p-values | Alternative Hypothesis | ||
| breakpoint index | greater | 2-sided | less |
| 6 | 0.08472 | 0.1694 | 0.9153 |
| 7 | 0.2349 | 0.4699 | 0.7651 |
| 8 | 0.1916 | 0.3831 | 0.8084 |
| 9 | 0.2134 | 0.4268 | 0.7866 |
| 10 | 0.2995 | 0.599 | 0.7005 |
| 11 | 0.199 | 0.398 | 0.801 |
| 12 | 0.1477 | 0.2953 | 0.8523 |
| 13 | 0.4639 | 0.9277 | 0.5361 |
| 14 | 0.709 | 0.5819 | 0.291 |
| 15 | 0.6799 | 0.6402 | 0.3201 |
| 16 | 0.8827 | 0.2346 | 0.1173 |
| 17 | 0.9152 | 0.1697 | 0.08484 |
| 18 | 0.8594 | 0.2811 | 0.1406 |
| 19 | 0.7898 | 0.4203 | 0.2102 |
| 20 | 0.7627 | 0.4745 | 0.2373 |
| 21 | 0.7031 | 0.5939 | 0.2969 |
| 22 | 0.6836 | 0.6327 | 0.3164 |
| 23 | 0.6748 | 0.6504 | 0.3252 |
| 24 | 0.6447 | 0.7107 | 0.3553 |
| Meta Analysis of Goldfeld-Quandt test for Heteroskedasticity | |||
| Description | # significant tests | % significant tests | OK/NOK |
| 1% type I error level | 0 | 0 | OK |
| 5% type I error level | 0 | 0 | OK |
| 10% type I error level | 0 | 0 | OK |