| Multiple Linear Regression - Estimated Regression Equation |
| Numeracy[t] = -4.19754 + 3.29852Gebgewicht[t] + 0.990607Fruit[t] -0.807084Sport[t] + 2.11651Alcohol[t] -0.535404Geslacht[t] + e[t] |
| Warning: you did not specify the column number of the endogenous series! The first column was selected by default. |
| Multiple Linear Regression - Ordinary Least Squares | |||||
| Variable | Parameter | S.D. | T-STAT H0: parameter = 0 | 2-tail p-value | 1-tail p-value |
| (Intercept) | -4.197 | 11.25 | -3.7300e-01 | 0.7148 | 0.3574 |
| Gebgewicht | +3.299 | 3.36 | +9.8180e-01 | 0.3429 | 0.1714 |
| Fruit | +0.9906 | 2.643 | +3.7480e-01 | 0.7134 | 0.3567 |
| Sport | -0.8071 | 2.849 | -2.8330e-01 | 0.7811 | 0.3906 |
| Alcohol | +2.116 | 2.7 | +7.8400e-01 | 0.4461 | 0.223 |
| Geslacht | -0.5354 | 2.504 | -2.1380e-01 | 0.8338 | 0.4169 |
| Multiple Linear Regression - Regression Statistics | |
| Multiple R | 0.3893 |
| R-squared | 0.1516 |
| Adjusted R-squared | -0.1515 |
| F-TEST (value) | 0.5001 |
| F-TEST (DF numerator) | 5 |
| F-TEST (DF denominator) | 14 |
| p-value | 0.7713 |
| Multiple Linear Regression - Residual Statistics | |
| Residual Standard Deviation | 5.385 |
| Sum Squared Residuals | 406 |
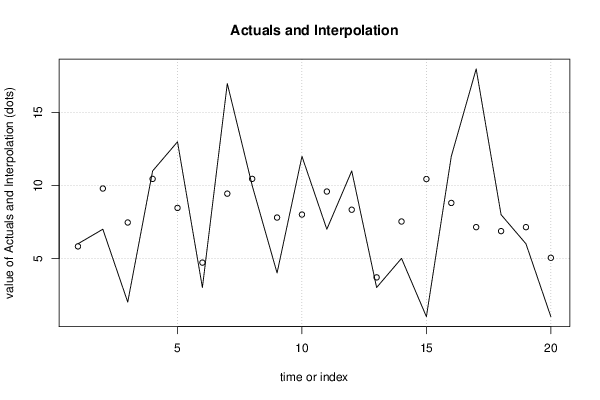
| Multiple Linear Regression - Actuals, Interpolation, and Residuals | |||
| Time or Index | Actuals | Interpolation Forecast | Residuals Prediction Error |
| 1 | 6 | 5.822 | 0.1777 |
| 2 | 7 | 9.795 | -2.795 |
| 3 | 2 | 7.463 | -5.463 |
| 4 | 11 | 10.45 | 0.5456 |
| 5 | 13 | 8.462 | 4.538 |
| 6 | 3 | 4.708 | -1.708 |
| 7 | 17 | 9.442 | 7.558 |
| 8 | 10 | 10.45 | -0.4544 |
| 9 | 4 | 7.801 | -3.801 |
| 10 | 12 | 8.008 | 3.992 |
| 11 | 7 | 9.588 | -2.588 |
| 12 | 11 | 8.338 | 2.662 |
| 13 | 3 | 3.696 | -0.6958 |
| 14 | 5 | 7.53 | -2.53 |
| 15 | 1 | 10.44 | -9.441 |
| 16 | 12 | 8.804 | 3.196 |
| 17 | 18 | 7.142 | 10.86 |
| 18 | 8 | 6.87 | 1.13 |
| 19 | 6 | 7.143 | -1.143 |
| 20 | 1 | 5.038 | -4.038 |