| Multiple Linear Regression - Estimated Regression Equation |
| dch[t] = + 2.37625 -0.928707cr[t] + e[t] |
| Multiple Linear Regression - Ordinary Least Squares | |||||
| Variable | Parameter | S.D. | T-STAT H0: parameter = 0 | 2-tail p-value | 1-tail p-value |
| (Intercept) | +2.376 | 0.3609 | +6.5840e+00 | 5.55e-07 | 2.775e-07 |
| cr | -0.9287 | 0.1226 | -7.5730e+00 | 4.866e-08 | 2.433e-08 |
| Multiple Linear Regression - Regression Statistics | |
| Multiple R | 0.8295 |
| R-squared | 0.6881 |
| Adjusted R-squared | 0.6761 |
| F-TEST (value) | 57.36 |
| F-TEST (DF numerator) | 1 |
| F-TEST (DF denominator) | 26 |
| p-value | 4.866e-08 |
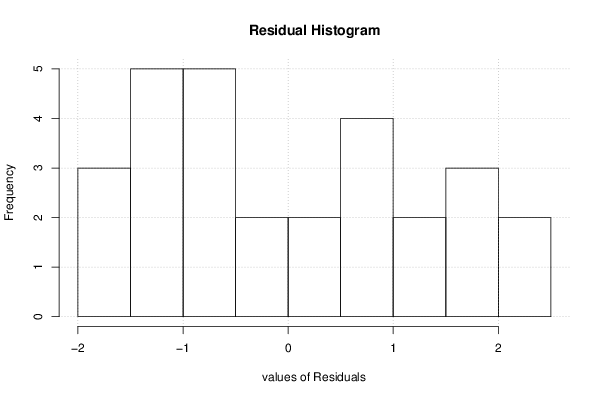
| Multiple Linear Regression - Residual Statistics | |
| Residual Standard Deviation | 1.319 |
| Sum Squared Residuals | 45.22 |
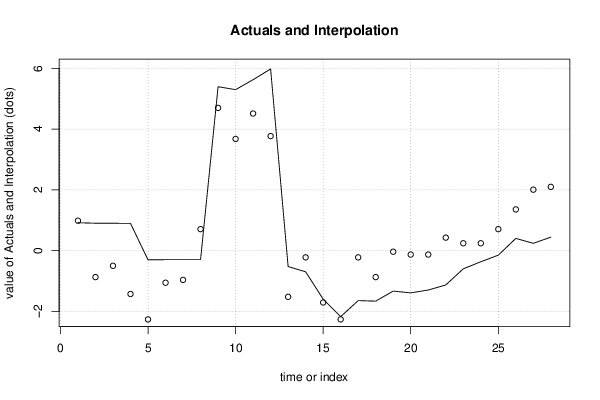
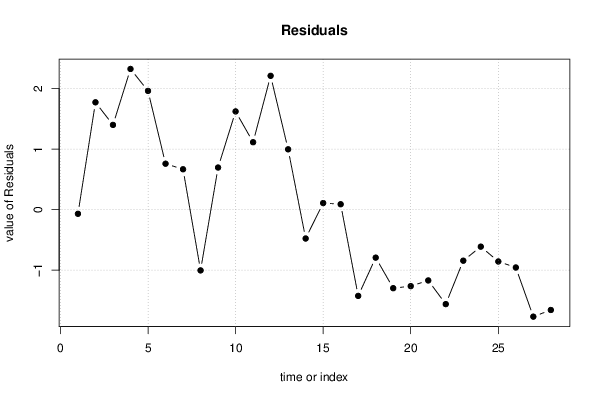
| Multiple Linear Regression - Actuals, Interpolation, and Residuals | |||
| Time or Index | Actuals | Interpolation Forecast | Residuals Prediction Error |
| 1 | 0.916 | 0.9832 | -0.06719 |
| 2 | 0.9 | -0.8742 | 1.774 |
| 3 | 0.898 | -0.5027 | 1.401 |
| 4 | 0.894 | -1.431 | 2.325 |
| 5 | -0.305 | -2.267 | 1.962 |
| 6 | -0.3 | -1.06 | 0.76 |
| 7 | -0.299 | -0.9671 | 0.6681 |
| 8 | -0.298 | 0.7046 | -1.003 |
| 9 | 5.395 | 4.698 | 0.697 |
| 10 | 5.3 | 3.676 | 1.624 |
| 11 | 5.627 | 4.512 | 1.115 |
| 12 | 5.981 | 3.769 | 2.212 |
| 13 | -0.527 | -1.524 | 0.9973 |
| 14 | -0.7 | -0.2241 | -0.4759 |
| 15 | -1.6 | -1.71 | 0.1101 |
| 16 | -2.177 | -2.267 | 0.09029 |
| 17 | -1.648 | -0.2241 | -1.424 |
| 18 | -1.666 | -0.8742 | -0.7918 |
| 19 | -1.335 | -0.03839 | -1.297 |
| 20 | -1.394 | -0.1313 | -1.263 |
| 21 | -1.3 | -0.1313 | -1.169 |
| 22 | -1.134 | 0.426 | -1.56 |
| 23 | -0.602 | 0.2402 | -0.8422 |
| 24 | -0.37 | 0.2402 | -0.6102 |
| 25 | -0.151 | 0.7046 | -0.8556 |
| 26 | 0.4 | 1.355 | -0.9547 |
| 27 | 0.238 | 2.005 | -1.767 |
| 28 | 0.441 | 2.098 | -1.657 |
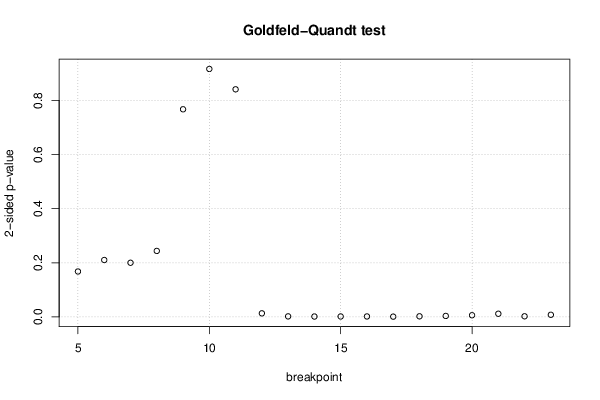
| Goldfeld-Quandt test for Heteroskedasticity | |||
| p-values | Alternative Hypothesis | ||
| breakpoint index | greater | 2-sided | less |
| 5 | 0.08388 | 0.1678 | 0.9161 |
| 6 | 0.1051 | 0.2102 | 0.8949 |
| 7 | 0.1 | 0.2001 | 0.9 |
| 8 | 0.1218 | 0.2437 | 0.8782 |
| 9 | 0.3835 | 0.767 | 0.6165 |
| 10 | 0.458 | 0.916 | 0.542 |
| 11 | 0.4204 | 0.8408 | 0.5796 |
| 12 | 0.9934 | 0.01315 | 0.006574 |
| 13 | 0.999 | 0.0019 | 0.00095 |
| 14 | 0.9993 | 0.001376 | 0.000688 |
| 15 | 0.9992 | 0.001552 | 0.000776 |
| 16 | 0.9992 | 0.00163 | 0.0008151 |
| 17 | 0.9996 | 0.0008736 | 0.0004368 |
| 18 | 0.9989 | 0.002158 | 0.001079 |
| 19 | 0.9983 | 0.003497 | 0.001748 |
| 20 | 0.997 | 0.006088 | 0.003044 |
| 21 | 0.9942 | 0.01164 | 0.005822 |
| 22 | 0.9989 | 0.002222 | 0.001111 |
| 23 | 0.9961 | 0.007739 | 0.00387 |
| Meta Analysis of Goldfeld-Quandt test for Heteroskedasticity | |||
| Description | # significant tests | % significant tests | OK/NOK |
| 1% type I error level | 10 | 0.5263 | NOK |
| 5% type I error level | 12 | 0.631579 | NOK |
| 10% type I error level | 12 | 0.631579 | NOK |