| Pearson Product Moment Correlation - Ungrouped Data | ||
| Statistic | Variable X | Variable Y |
| Mean | 94.8 | 40 |
| Biased Variance | 11116.16 | 680 |
| Biased Standard Deviation | 105.433201601772 | 26.0768096208106 |
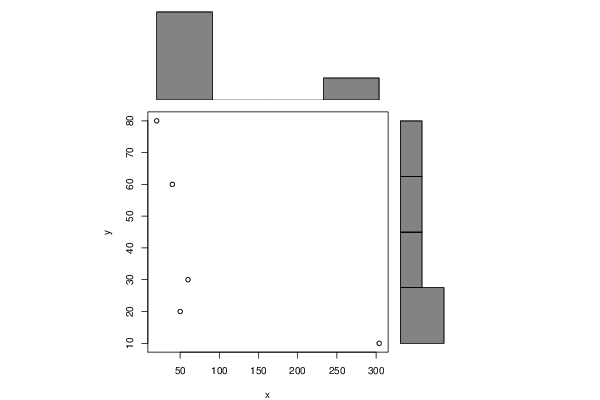
| Covariance | -2280 | |
| Correlation | -0.663426756659396 | |
| Determination | 0.440135061451606 | |
| T-Test | -1.53571976961357 | |
| p-value (2 sided) | 0.222182725928553 | |
| p-value (1 sided) | 0.111091362964276 | |
| 95% CI of Correlation | [-0.9750044204894, 0.527730351693396] | |
| Degrees of Freedom | 3 | |
| Number of Observations | 5 | |
| Normality Tests |
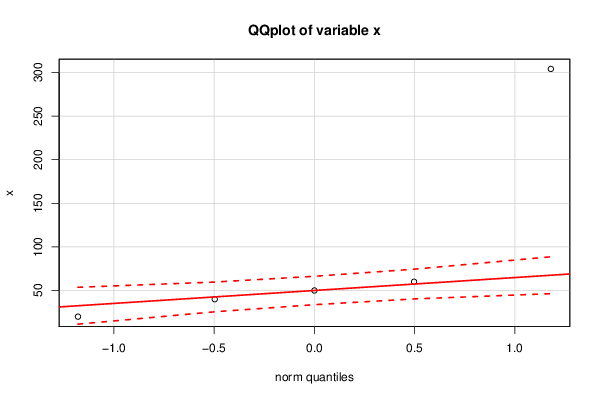
> jarque.x Jarque-Bera Normality Test data: x JB = 1.7351, p-value = 0.42 alternative hypothesis: greater |
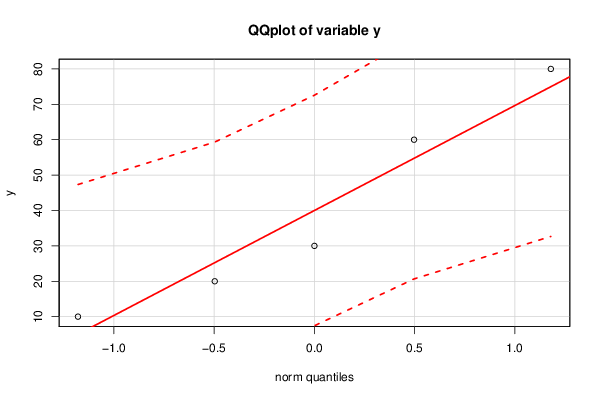
> jarque.y Jarque-Bera Normality Test data: y JB = 0.54552, p-value = 0.7613 alternative hypothesis: greater |