| Pearson Product Moment Correlation - Ungrouped Data | ||
| Statistic | Variable X | Variable Y |
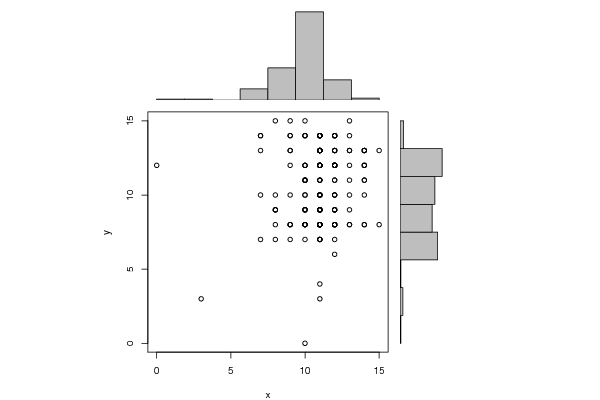
| Mean | 10.9526627218935 | 10.5798816568047 |
| Biased Variance | 3.60722663772277 | 7.09568992682329 |
| Biased Standard Deviation | 1.89927002759554 | 2.66377362529613 |
| Covariance | 0.575232459847844 | |
| Correlation | 0.113026930310425 | |
| Determination | 0.0127750869753977 | |
| T-Test | 1.47005002956248 | |
| p-value (2 sided) | 0.143429697864756 | |
| p-value (1 sided) | 0.0717148489323782 | |
| 95% CI of Correlation | [-0.0385915691007967, 0.259558234193628] | |
| Degrees of Freedom | 167 | |
| Number of Observations | 169 | |
| Normality Tests |
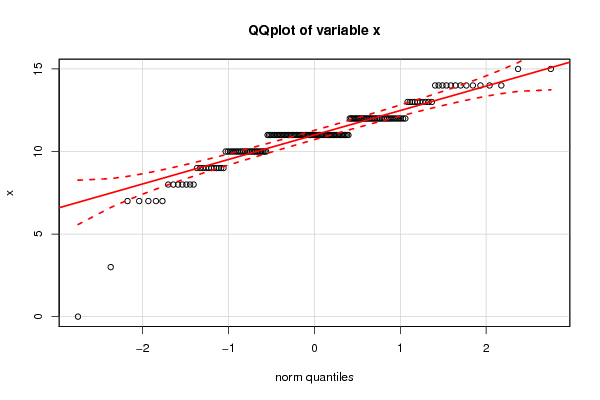
> jarque.x Jarque-Bera Normality Test data: x JB = 419.4, p-value < 2.2e-16 alternative hypothesis: greater |
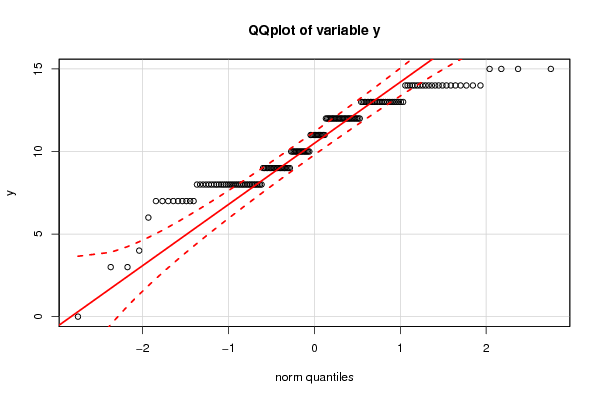
> jarque.y Jarque-Bera Normality Test data: y JB = 11.405, p-value = 0.003338 alternative hypothesis: greater |
> ad.x Anderson-Darling normality test data: x A = 6.038, p-value = 6.619e-15 |
> ad.y Anderson-Darling normality test data: y A = 3.5672, p-value = 6.041e-09 |