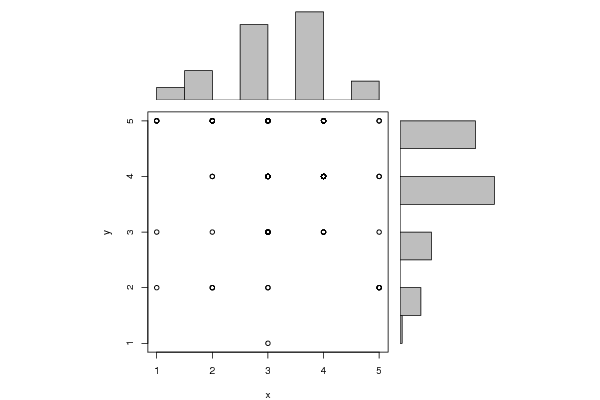
| Pearson Product Moment Correlation - Ungrouped Data | ||
| Statistic | Variable X | Variable Y |
| Mean | 3.31775700934579 | 3.98130841121495 |
| Biased Variance | 0.983142632544327 | 0.934230063761027 |
| Biased Standard Deviation | 0.991535492327091 | 0.966555773745637 |
| Covariance | -0.0694762828425322 | |
| Correlation | -0.0718163747079687 | |
| Determination | 0.00515759167619537 | |
| T-Test | -0.737803961221249 | |
| p-value (2 sided) | 0.462279295986738 | |
| p-value (1 sided) | 0.231139647993369 | |
| 95% CI of Correlation | [-0.25815485832701, 0.119673780769822] | |
| Degrees of Freedom | 105 | |
| Number of Observations | 107 | |
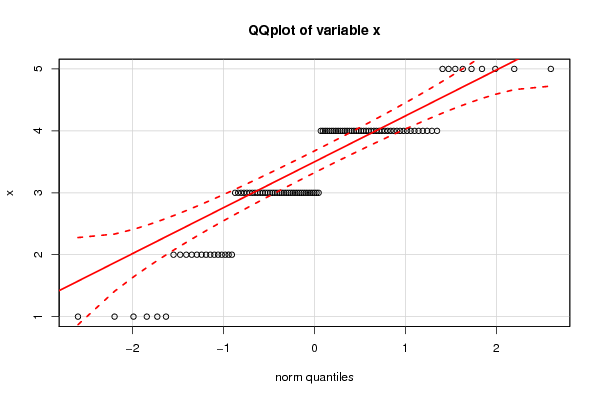
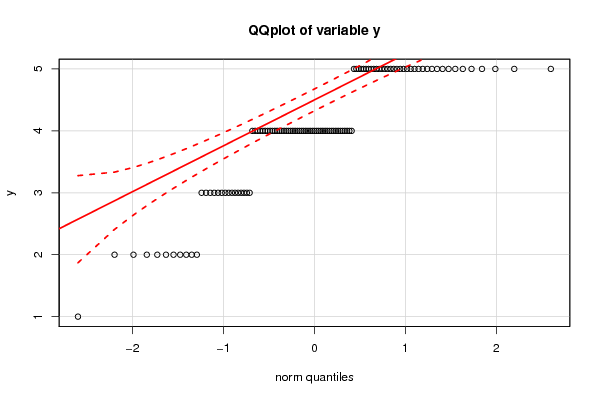
| Normality Tests |
> jarque.x Jarque-Bera Normality Test data: x JB = 4.4579, p-value = 0.1076 alternative hypothesis: greater |
> jarque.y Jarque-Bera Normality Test data: y JB = 12.363, p-value = 0.002068 alternative hypothesis: greater |
> ad.x Anderson-Darling normality test data: x A = 5.2784, p-value = 4.062e-13 |
> ad.y Anderson-Darling normality test data: y A = 6.9224, p-value < 2.2e-16 |