| Pearson Product Moment Correlation - Ungrouped Data | ||
| Statistic | Variable X | Variable Y |
| Mean | 3.26114649681529 | 3.94267515923567 |
| Biased Variance | 0.880847093188365 | 0.283338066453 |
| Biased Standard Deviation | 0.938534545548732 | 0.532295093395571 |
| Covariance | 0.00865588763677936 | |
| Correlation | 0.0172160624920884 | |
| Determination | 0.000296392807731495 | |
| T-Test | 0.214370020719733 | |
| p-value (2 sided) | 0.830540279541707 | |
| p-value (1 sided) | 0.415270139770854 | |
| 95% CI of Correlation | [-0.139799070051655, 0.173386629676104] | |
| Degrees of Freedom | 155 | |
| Number of Observations | 157 | |
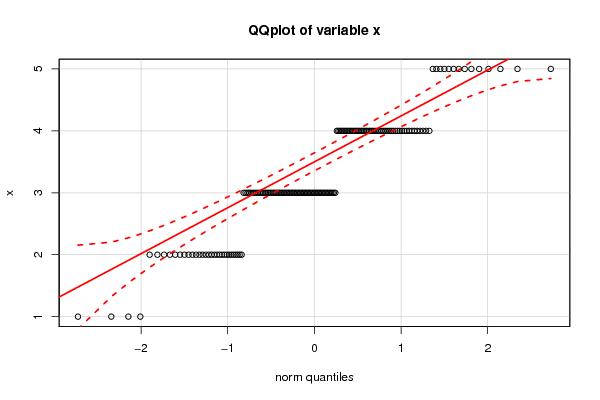
| Normality Tests |
> jarque.x Jarque-Bera Normality Test data: x JB = 1.1406, p-value = 0.5654 alternative hypothesis: greater |
> jarque.y Jarque-Bera Normality Test data: y JB = 38.869, p-value = 3.629e-09 alternative hypothesis: greater |
> ad.x Anderson-Darling normality test data: x A = 7.2186, p-value < 2.2e-16 |
> ad.y Anderson-Darling normality test data: y A = 25.996, p-value < 2.2e-16 |