| Pearson Product Moment Correlation - Ungrouped Data | ||
| Statistic | Variable X | Variable Y |
| Mean | 4.3109756097561 | 4.20121951219512 |
| Biased Variance | 0.555733194527067 | 0.404632659131469 |
| Biased Standard Deviation | 0.745475146820514 | 0.636107427351284 |
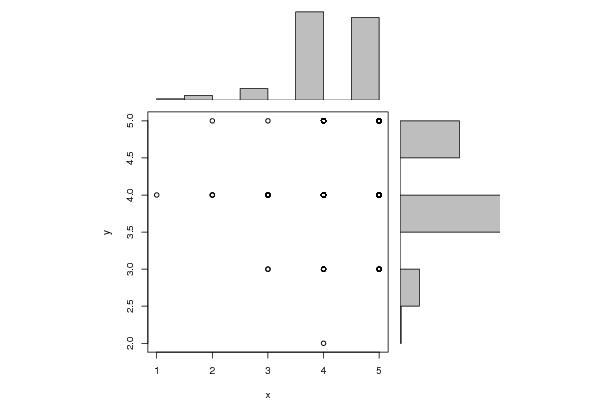
| Covariance | 0.0106613796199312 | |
| Correlation | 0.0223456775804886 | |
| Determination | 0.000499329306531152 | |
| T-Test | 0.284485077389435 | |
| p-value (2 sided) | 0.776401988707607 | |
| p-value (1 sided) | 0.388200994353803 | |
| 95% CI of Correlation | [-0.131354029211336, 0.174996296077949] | |
| Degrees of Freedom | 162 | |
| Number of Observations | 164 | |
| Normality Tests |
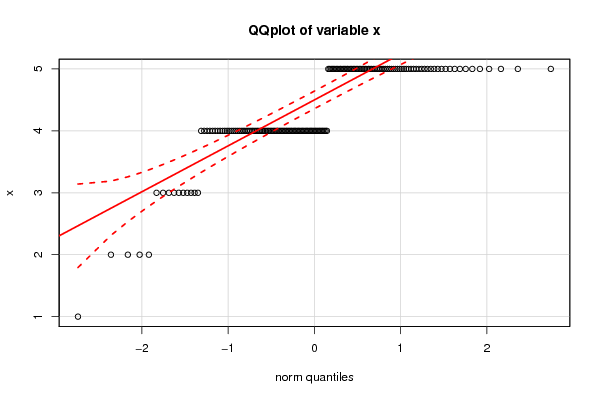
> jarque.x Jarque-Bera Normality Test data: x JB = 88.966, p-value < 2.2e-16 alternative hypothesis: greater |
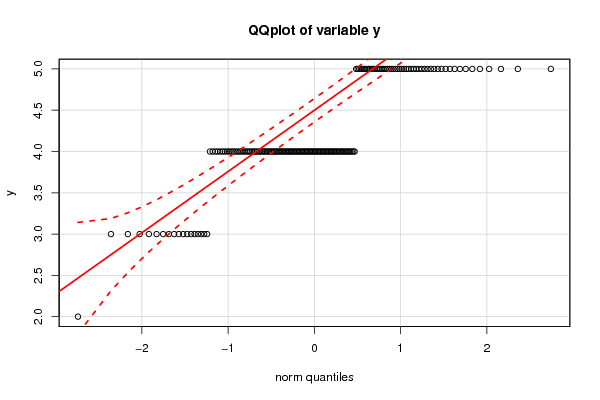
> jarque.y Jarque-Bera Normality Test data: y JB = 3.1798, p-value = 0.2039 alternative hypothesis: greater |
> ad.x Anderson-Darling normality test data: x A = 15.66, p-value < 2.2e-16 |
> ad.y Anderson-Darling normality test data: y A = 17.189, p-value < 2.2e-16 |