| Pearson Product Moment Correlation - Ungrouped Data | ||
| Statistic | Variable X | Variable Y |
| Mean | 3.95121951219512 | 4.20731707317073 |
| Biased Variance | 0.363474122546104 | 0.396044021415824 |
| Biased Standard Deviation | 0.602888150941867 | 0.629320285241008 |
| Covariance | 0.169684273529852 | |
| Correlation | 0.444505225245189 | |
| Determination | 0.197584895270276 | |
| T-Test | 6.3158939646872 | |
| p-value (2 sided) | 2.48197215390899e-09 | |
| p-value (1 sided) | 1.2409860769545e-09 | |
| 95% CI of Correlation | [0.312546094251874, 0.559632722186043] | |
| Degrees of Freedom | 162 | |
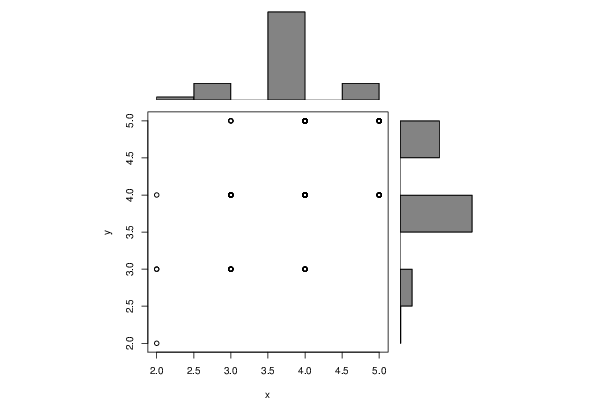
| Number of Observations | 164 | |
| Normality Tests |
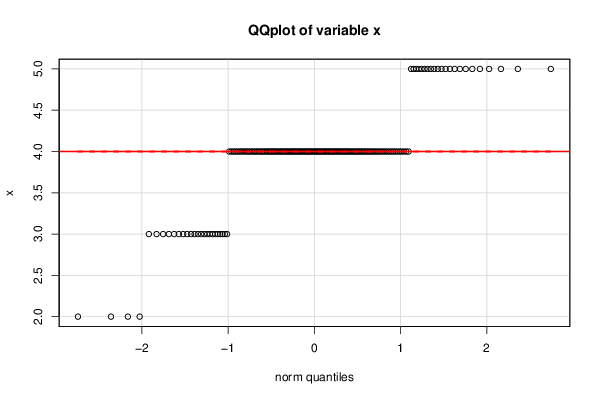
> jarque.x Jarque-Bera Normality Test data: x JB = 32.038, p-value = 1.104e-07 alternative hypothesis: greater |
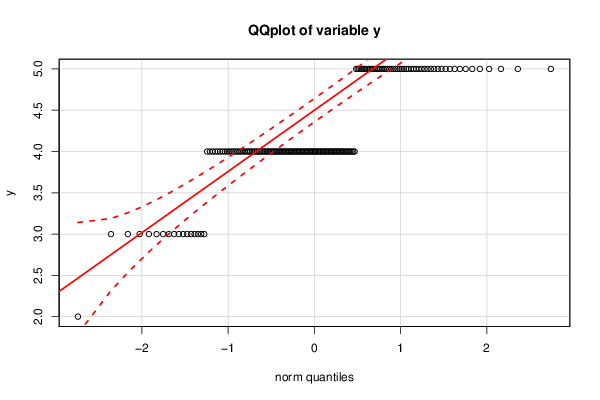
> jarque.y Jarque-Bera Normality Test data: y JB = 3.1583, p-value = 0.2061 alternative hypothesis: greater |
> ad.x Anderson-Darling normality test data: x A = 22.634, p-value < 2.2e-16 |
> ad.y Anderson-Darling normality test data: y A = 17.617, p-value < 2.2e-16 |