Free Statistics

of Irreproducible Research!

Author's title

Author*Unverified author*
R Software Modulerwasp_notchedbox1.wasp
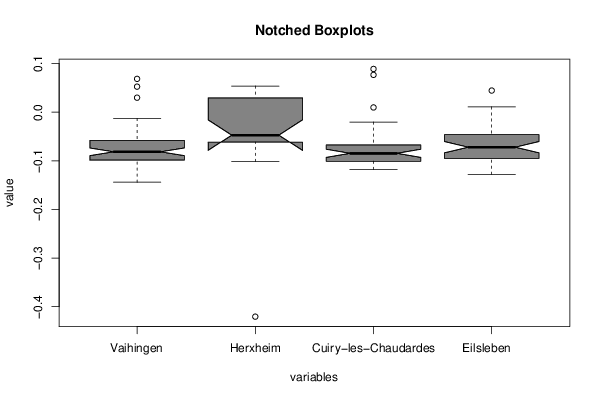
Title produced by softwareNotched Boxplots
Date of computationTue, 25 Oct 2016 14:15:45 +0100
Cite this page as followsStatistical Computations at FreeStatistics.org, Office for Research Development and Education, URL https://freestatistics.org/blog/index.php?v=date/2016/Oct/25/t1477401679ko76ui316q2i5ak.htm/, Retrieved Wed, 24 Apr 2024 19:18:32 +0200
Statistical Computations at FreeStatistics.org, Office for Research Development and Education, URL https://freestatistics.org/blog/index.php?pk=, Retrieved Wed, 24 Apr 2024 19:18:32 +0200
QR Codes:

Original text written by user:
IsPrivate?No (this computation is public)
User-defined keywords
Estimated Impact0
Dataseries X:
0.0299	0.0538	0.0098	0.0446
0.0526	0.0499	-0.0202	-0.0202
-0.0662	0.0054	0.0890	0.0098
-0.0244	0.0472	0.0768	0.0098
-0.0784	0.0296	-0.0635	-0.0560
-0.0824	-0.0617	-0.0728	-0.0212
-0.0894	-0.0562	-0.1046	-0.0129
-0.1210	-0.0882	-0.1046	0.0110
-0.0651	-0.1014	-0.0845	-0.0560
-0.0582	-0.0872	-0.0687	-0.0470
-0.1056	-0.4204	-0.0992	-0.0212
-0.1116	-0.0472	-0.0672	-0.1021
-0.1205	-0.0601	-0.0845	-0.0728
-0.0732	-0.0734	-0.0388	-0.0894
-0.0466	-0.0587	-0.0845	-0.0692
-0.1004	0.0078	-0.1093	-0.1168
-0.0425	0.0410	-0.0845	-0.0698
-0.1298	-0.0497	-0.0845	-0.1046
-0.0463	-0.0200	-0.0535	-0.1093
-0.0694	-0.0283	-0.1009	-0.1009
-0.0317	0.0516	-0.1093	-0.0845
-0.1143	NA	-0.1009	-0.0461
-0.0877	NA	-0.1179	-0.0107
-0.1256	NA	-0.1179	-0.1009
-0.0695	NA	-0.1179	-0.0845
-0.1009	NA	-0.1009	-0.0845
-0.0920	NA	-0.0829	-0.0535
-0.1092	NA	-0.1009	0.0026
-0.0943	NA	-0.0245	-0.0926
-0.0641	NA	-0.1030	-0.0687
-0.0845	NA	-0.0872	-0.0687
-0.0877	NA	-0.0430	-0.1194
-0.0577	NA	-0.0872	-0.1194
-0.0834	NA	-0.0719	-0.1030
-0.0961	NA	-0.0719	-0.0795
-0.0613	NA	-0.1030	-0.0795
-0.0804	NA	-0.0719	-0.0719
-0.0971	NA	-0.0572	-0.0872
-0.0790	NA	-0.0872	-0.1030
-0.0707	NA	-0.0719	-0.0950
-0.0253	NA	-0.0719	-0.0719
-0.1009	NA	NA	-0.1278
-0.1383	NA	NA	-0.0872
-0.0712	NA	NA	-0.0719
-0.1439	NA	NA	-0.0430
-0.1039	NA	NA	NA
-0.0699	NA	NA	NA
-0.0964	NA	NA	NA
-0.1095	NA	NA	NA
-0.0529	NA	NA	NA
-0.1210	NA	NA	NA
-0.0251	NA	NA	NA
-0.0897	NA	NA	NA
-0.0768	NA	NA	NA
-0.0590	NA	NA	NA
-0.0884	NA	NA	NA
-0.0953	NA	NA	NA
-0.0875	NA	NA	NA
-0.0852	NA	NA	NA
-0.1012	NA	NA	NA
-0.0937	NA	NA	NA
-0.0650	NA	NA	NA
-0.0246	NA	NA	NA
-0.0528	NA	NA	NA
-0.0488	NA	NA	NA
-0.0200	NA	NA	NA
0.0686	NA	NA	NA
-0.0127	NA	NA	NA


Summary of computational transaction
Raw Inputview raw input (R code)
Raw Outputview raw output of R engine
Computing time1 seconds
R Server'Sir Maurice George Kendall' @ kendall.wessa.net
R Framework error message
The field 'Names of X columns' contains a hard return which cannot be interpreted.
Please, resubmit your request without hard returns in the 'Names of X columns'.

\begin{tabular}{lllllllll}
\hline
Summary of computational transaction \tabularnewline
Raw Input & view raw input (R code)  \tabularnewline
Raw Output & view raw output of R engine  \tabularnewline
Computing time & 1 seconds \tabularnewline
R Server & 'Sir Maurice George Kendall' @ kendall.wessa.net \tabularnewline
R Framework error message & 
The field 'Names of X columns' contains a hard return which cannot be interpreted.
Please, resubmit your request without hard returns in the 'Names of X columns'.
\tabularnewline \hline \end{tabular} %Source: https://freestatistics.org/blog/index.php?pk=&T=0

[TABLE]
[ROW][C]Summary of computational transaction[/C][/ROW]
[ROW][C]Raw Input[/C][C]view raw input (R code) [/C][/ROW]
[ROW][C]Raw Output[/C][C]view raw output of R engine [/C][/ROW]
[ROW][C]Computing time[/C][C]1 seconds[/C][/ROW]
[ROW][C]R Server[/C][C]'Sir Maurice George Kendall' @ kendall.wessa.net[/C][/ROW]
[ROW][C]R Framework error message[/C][C]
The field 'Names of X columns' contains a hard return which cannot be interpreted.
Please, resubmit your request without hard returns in the 'Names of X columns'.
[/C][/ROW] [/TABLE] Source: https://freestatistics.org/blog/index.php?pk=&T=0

Globally Unique Identifier (entire table): ba.freestatistics.org/blog/index.php?pk=&T=0

As an alternative you can also use a QR Code:  

The GUIDs for individual cells are displayed in the table below:

Summary of computational transaction
Raw Inputview raw input (R code)
Raw Outputview raw output of R engine
Computing time1 seconds
R Server'Sir Maurice George Kendall' @ kendall.wessa.net
R Framework error message
The field 'Names of X columns' contains a hard return which cannot be interpreted.
Please, resubmit your request without hard returns in the 'Names of X columns'.


Boxplot statistics
Variablelower whiskerlower hingemedianupper hingeupper whisker
Vaihingen-0.1439-0.09875-0.0814-0.05795-0.0127
Herxheim-0.1014-0.0617-0.04720.02960.0538
Cuiry-les-Chaudardes-0.1179-0.1009-0.0845-0.0672-0.0202
Eilsleben -0.1278-0.095-0.0719-0.04610.011

\begin{tabular}{lllllllll}
\hline
Boxplot statistics \tabularnewline
Variable & lower whisker & lower hinge & median & upper hinge & upper whisker \tabularnewline
Vaihingen & -0.1439 & -0.09875 & -0.0814 & -0.05795 & -0.0127 \tabularnewline
Herxheim & -0.1014 & -0.0617 & -0.0472 & 0.0296 & 0.0538 \tabularnewline
Cuiry-les-Chaudardes & -0.1179 & -0.1009 & -0.0845 & -0.0672 & -0.0202 \tabularnewline
Eilsleben


 & -0.1278 & -0.095 & -0.0719 & -0.0461 & 0.011 \tabularnewline
\hline
\end{tabular}
%Source: https://freestatistics.org/blog/index.php?pk=&T=1

[TABLE]
[ROW][C]Boxplot statistics[/C][/ROW]
[ROW][C]Variable[/C][C]lower whisker[/C][C]lower hinge[/C][C]median[/C][C]upper hinge[/C][C]upper whisker[/C][/ROW]
[ROW][C]Vaihingen[/C][C]-0.1439[/C][C]-0.09875[/C][C]-0.0814[/C][C]-0.05795[/C][C]-0.0127[/C][/ROW]
[ROW][C]Herxheim[/C][C]-0.1014[/C][C]-0.0617[/C][C]-0.0472[/C][C]0.0296[/C][C]0.0538[/C][/ROW]
[ROW][C]Cuiry-les-Chaudardes[/C][C]-0.1179[/C][C]-0.1009[/C][C]-0.0845[/C][C]-0.0672[/C][C]-0.0202[/C][/ROW]
[ROW][C]Eilsleben


[/C][C]-0.1278[/C][C]-0.095[/C][C]-0.0719[/C][C]-0.0461[/C][C]0.011[/C][/ROW]
[/TABLE]
Source: https://freestatistics.org/blog/index.php?pk=&T=1

Globally Unique Identifier (entire table): ba.freestatistics.org/blog/index.php?pk=&T=1

As an alternative you can also use a QR Code:  

The GUIDs for individual cells are displayed in the table below:

Boxplot statistics
Variablelower whiskerlower hingemedianupper hingeupper whisker
Vaihingen-0.1439-0.09875-0.0814-0.05795-0.0127
Herxheim-0.1014-0.0617-0.04720.02960.0538
Cuiry-les-Chaudardes-0.1179-0.1009-0.0845-0.0672-0.0202
Eilsleben -0.1278-0.095-0.0719-0.04610.011


Boxplot Notches
Variablelower boundmedianupper bound
Vaihingen-0.0892174082661711-0.0814-0.0735825917338289
Herxheim-0.0786788035381028-0.0472-0.0157211964618972
Cuiry-les-Chaudardes-0.0928156281255207-0.0845-0.0761843718744793
Eilsleben -0.0834175389385059-0.0719-0.0603824610614941

\begin{tabular}{lllllllll}
\hline
Boxplot Notches \tabularnewline
Variable & lower bound & median & upper bound \tabularnewline
Vaihingen & -0.0892174082661711 & -0.0814 & -0.0735825917338289 \tabularnewline
Herxheim & -0.0786788035381028 & -0.0472 & -0.0157211964618972 \tabularnewline
Cuiry-les-Chaudardes & -0.0928156281255207 & -0.0845 & -0.0761843718744793 \tabularnewline
Eilsleben


 & -0.0834175389385059 & -0.0719 & -0.0603824610614941 \tabularnewline
\hline
\end{tabular}
%Source: https://freestatistics.org/blog/index.php?pk=&T=2

[TABLE]
[ROW][C]Boxplot Notches[/C][/ROW]
[ROW][C]Variable[/C][C]lower bound[/C][C]median[/C][C]upper bound[/C][/ROW]
[ROW][C]Vaihingen[/C][C]-0.0892174082661711[/C][C]-0.0814[/C][C]-0.0735825917338289[/C][/ROW]
[ROW][C]Herxheim[/C][C]-0.0786788035381028[/C][C]-0.0472[/C][C]-0.0157211964618972[/C][/ROW]
[ROW][C]Cuiry-les-Chaudardes[/C][C]-0.0928156281255207[/C][C]-0.0845[/C][C]-0.0761843718744793[/C][/ROW]
[ROW][C]Eilsleben


[/C][C]-0.0834175389385059[/C][C]-0.0719[/C][C]-0.0603824610614941[/C][/ROW]
[/TABLE]
Source: https://freestatistics.org/blog/index.php?pk=&T=2

Globally Unique Identifier (entire table): ba.freestatistics.org/blog/index.php?pk=&T=2

As an alternative you can also use a QR Code:  

The GUIDs for individual cells are displayed in the table below:

Boxplot Notches
Variablelower boundmedianupper bound
Vaihingen-0.0892174082661711-0.0814-0.0735825917338289
Herxheim-0.0786788035381028-0.0472-0.0157211964618972
Cuiry-les-Chaudardes-0.0928156281255207-0.0845-0.0761843718744793
Eilsleben -0.0834175389385059-0.0719-0.0603824610614941


Parameters (Session):
par1 = grey ; par2 = no ;
Parameters (R input):
par1 = grey ; par2 = no ;
R code (references can be found in the software module):
par2 <- 'no'
par1 <- 'grey'
if(par2=='yes') {
z <- na.omit(as.data.frame(t(y)))
} else {
z <- as.data.frame(t(y))
}
bitmap(file='test1.png')
(r<-boxplot(z ,xlab=xlab,ylab=ylab,main=main,notch=TRUE,col=par1))
dev.off()
load(file='createtable')
a<-table.start()
a<-table.row.start(a)
a<-table.element(a,hyperlink('overview.htm','Boxplot statistics','Boxplot overview'),6,TRUE)
a<-table.row.end(a)
a<-table.row.start(a)
a<-table.element(a,'Variable',1,TRUE)
a<-table.element(a,hyperlink('lower_whisker.htm','lower whisker','definition of lower whisker'),1,TRUE)
a<-table.element(a,hyperlink('lower_hinge.htm','lower hinge','definition of lower hinge'),1,TRUE)
a<-table.element(a,hyperlink('central_tendency.htm','median','definitions about measures of central tendency'),1,TRUE)
a<-table.element(a,hyperlink('upper_hinge.htm','upper hinge','definition of upper hinge'),1,TRUE)
a<-table.element(a,hyperlink('upper_whisker.htm','upper whisker','definition of upper whisker'),1,TRUE)
a<-table.row.end(a)
for (i in 1:length(y[,1]))
{
a<-table.row.start(a)
a<-table.element(a,dimnames(t(x))[[2]][i],1,TRUE)
for (j in 1:5)
{
a<-table.element(a,r$stats[j,i])
}
a<-table.row.end(a)
}
a<-table.end(a)
table.save(a,file='mytable.tab')
a<-table.start()
a<-table.row.start(a)
a<-table.element(a,'Boxplot Notches',4,TRUE)
a<-table.row.end(a)
a<-table.row.start(a)
a<-table.element(a,'Variable',1,TRUE)
a<-table.element(a,'lower bound',1,TRUE)
a<-table.element(a,'median',1,TRUE)
a<-table.element(a,'upper bound',1,TRUE)
a<-table.row.end(a)
for (i in 1:length(y[,1]))
{
a<-table.row.start(a)
a<-table.element(a,dimnames(t(x))[[2]][i],1,TRUE)
a<-table.element(a,r$conf[1,i])
a<-table.element(a,r$stats[3,i])
a<-table.element(a,r$conf[2,i])
a<-table.row.end(a)
}
a<-table.end(a)
table.save(a,file='mytable1.tab')