| Pearson Product Moment Correlation - Ungrouped Data | ||
| Statistic | Variable X | Variable Y |
| Mean | 57.2727272727273 | 54.8290909090909 |
| Biased Variance | 367.91955922865 | 485.864123415978 |
| Biased Standard Deviation | 19.1812293461251 | 22.0423257261111 |
| Covariance | -323.84822616408 | |
| Correlation | -0.761320584747334 | |
| Determination | 0.579609032760022 | |
| T-Test | -14.9911409226595 | |
| p-value (2 sided) | 1.73569708422792e-32 | |
| p-value (1 sided) | 8.67848542113962e-33 | |
| 95% CI of Correlation | [-0.818856948536498, -0.688637441395562] | |
| Degrees of Freedom | 163 | |
| Number of Observations | 165 | |
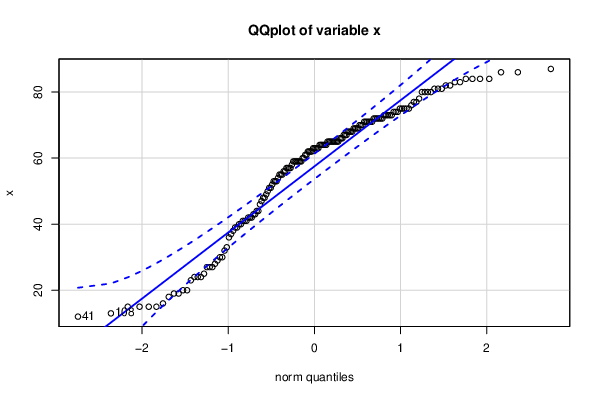
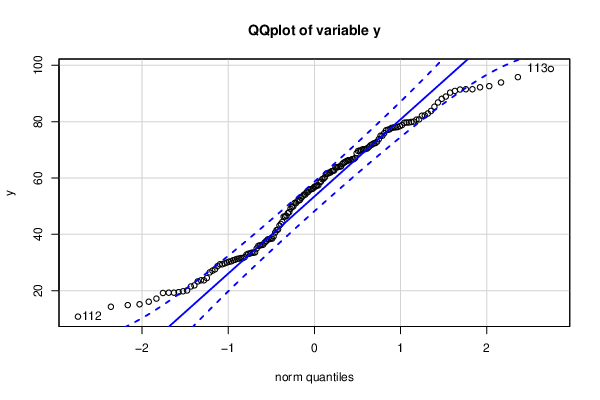
| Normality Tests |
> jarque.x Jarque-Bera Normality Test data: x JB = 15.599, p-value = 0.00041 alternative hypothesis: greater |
> jarque.y Jarque-Bera Normality Test data: y JB = 7.6735, p-value = 0.02156 alternative hypothesis: greater |
> ad.x Anderson-Darling normality test data: x A = 3.985, p-value = 5.825e-10 |
> ad.y Anderson-Darling normality test data: y A = 1.5243, p-value = 0.0006081 |