| Multiple Linear Regression - Estimated Regression Equation |
| Score[t] = -201.756 -4.75902X1[t] -0.66876X2[t] + 0.0124927X3[t] -2.1475X4[t] + 122.545X5[t] -17.4807X6[t] + e[t] |
| Multiple Linear Regression - Ordinary Least Squares | |||||
| Variable | Parameter | S.D. | T-STAT H0: parameter = 0 | 2-tail p-value | 1-tail p-value |
| (Intercept) | -201.8 | 50.62 | -3.9850e+00 | 0.001555 | 0.0007773 |
| X1 | -4.759 | 2.25 | -2.1160e+00 | 0.05426 | 0.02713 |
| X2 | -0.6688 | 1.915 | -3.4910e-01 | 0.7326 | 0.3663 |
| X3 | +0.01249 | 1.942 | +6.4340e-03 | 0.995 | 0.4975 |
| X4 | -2.147 | 2.166 | -9.9170e-01 | 0.3395 | 0.1697 |
| X5 | +122.5 | 30.1 | +4.0710e+00 | 0.001323 | 0.0006615 |
| X6 | -17.48 | 4.4 | -3.9730e+00 | 0.001592 | 0.0007961 |
| Multiple Linear Regression - Regression Statistics | |
| Multiple R | 0.7973 |
| R-squared | 0.6357 |
| Adjusted R-squared | 0.4675 |
| F-TEST (value) | 3.781 |
| F-TEST (DF numerator) | 6 |
| F-TEST (DF denominator) | 13 |
| p-value | 0.02114 |
| Multiple Linear Regression - Residual Statistics | |
| Residual Standard Deviation | 3.662 |
| Sum Squared Residuals | 174.3 |
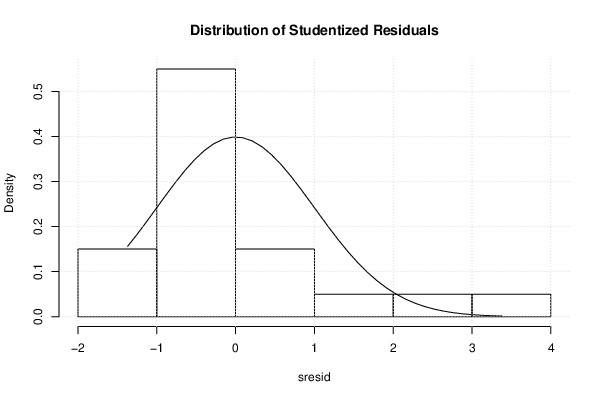
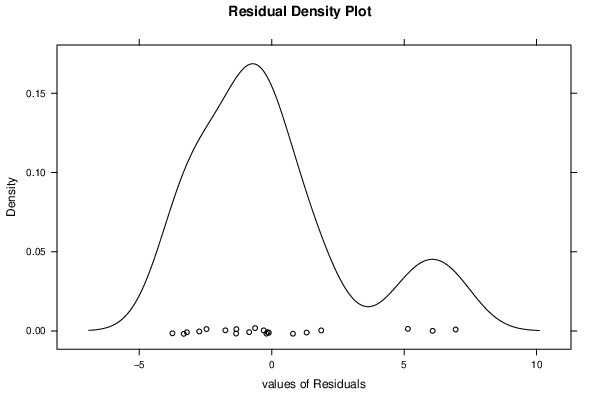
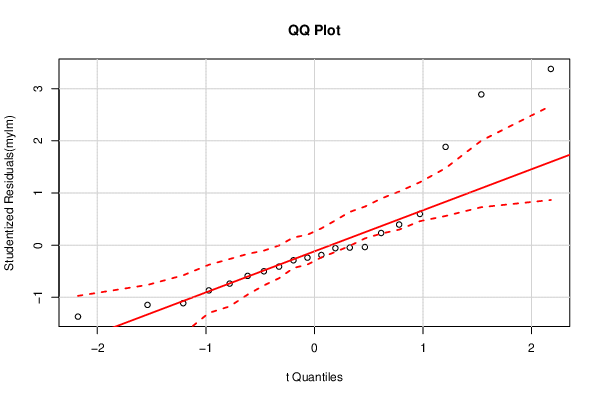
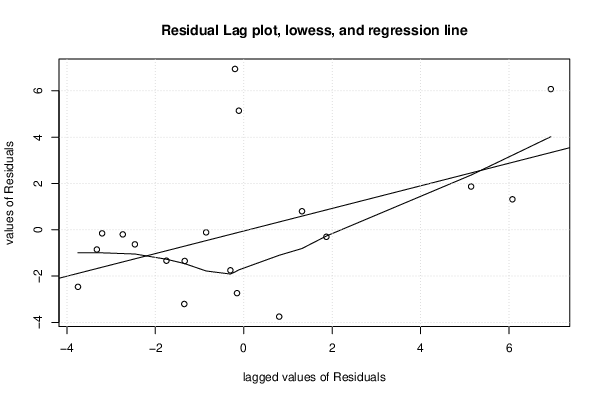
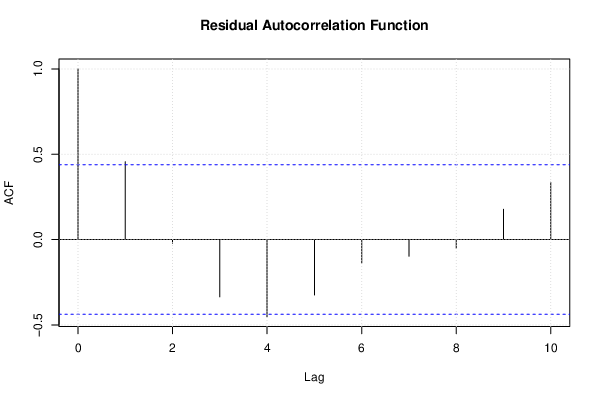
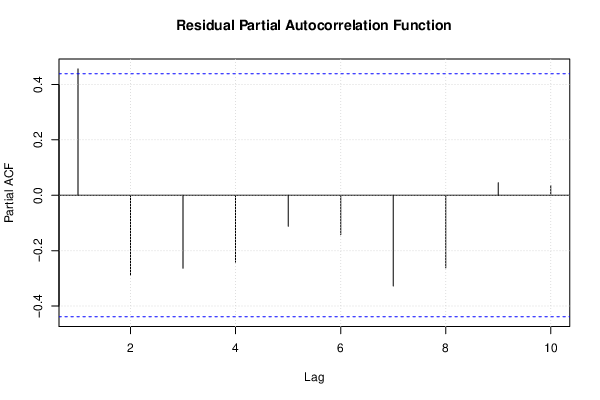
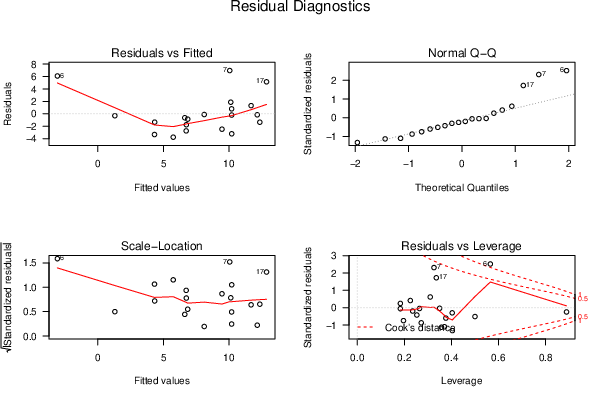
| Menu of Residual Diagnostics | |
| Description | Link |
| Histogram | Compute |
| Central Tendency | Compute |
| QQ Plot | Compute |
| Kernel Density Plot | Compute |
| Skewness/Kurtosis Test | Compute |
| Skewness-Kurtosis Plot | Compute |
| Harrell-Davis Plot | Compute |
| Bootstrap Plot -- Central Tendency | Compute |
| Blocked Bootstrap Plot -- Central Tendency | Compute |
| (Partial) Autocorrelation Plot | Compute |
| Spectral Analysis | Compute |
| Tukey lambda PPCC Plot | Compute |
| Box-Cox Normality Plot | Compute |
| Summary Statistics | Compute |
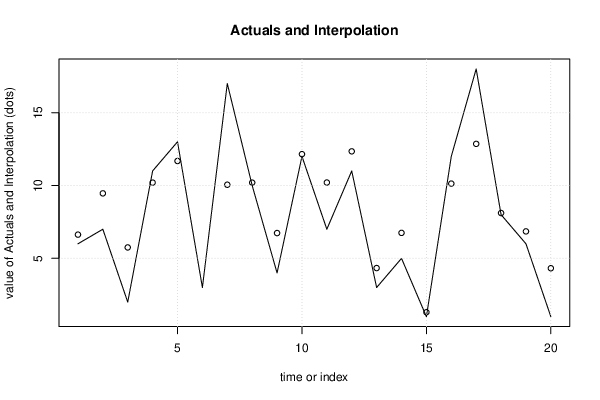
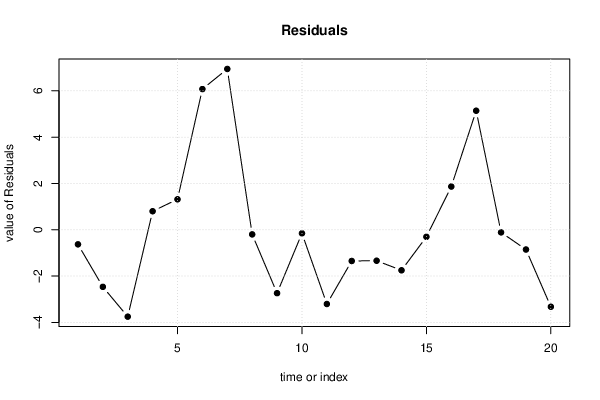
| Multiple Linear Regression - Actuals, Interpolation, and Residuals | |||
| Time or Index | Actuals | Interpolation Forecast | Residuals Prediction Error |
| 1 | 6 | 6.628 | -0.6282 |
| 2 | 7 | 9.463 | -2.463 |
| 3 | 2 | 5.75 | -3.75 |
| 4 | 11 | 10.2 | 0.8016 |
| 5 | 13 | 11.68 | 1.317 |
| 6 | 3 | -3.077 | 6.077 |
| 7 | 17 | 10.05 | 6.946 |
| 8 | 10 | 10.2 | -0.1984 |
| 9 | 4 | 6.737 | -2.737 |
| 10 | 12 | 12.15 | -0.153 |
| 11 | 7 | 10.2 | -3.204 |
| 12 | 11 | 12.35 | -1.346 |
| 13 | 3 | 4.335 | -1.335 |
| 14 | 5 | 6.749 | -1.749 |
| 15 | 1 | 1.303 | -0.3027 |
| 16 | 12 | 10.13 | 1.868 |
| 17 | 18 | 12.86 | 5.142 |
| 18 | 8 | 8.111 | -0.1113 |
| 19 | 6 | 6.851 | -0.8515 |
| 20 | 1 | 4.323 | -3.323 |
| Ramsey RESET F-Test for powers (2 and 3) of fitted values |
> reset_test_fitted RESET test data: mylm RESET = 6.367, df1 = 2, df2 = 11, p-value = 0.01456 |
| Ramsey RESET F-Test for powers (2 and 3) of regressors |
> reset_test_regressors RESET test data: mylm RESET = 0.10705, df1 = 12, df2 = 1, p-value = 0.99 |
| Ramsey RESET F-Test for powers (2 and 3) of principal components |
> reset_test_principal_components RESET test data: mylm RESET = 1.4972, df1 = 2, df2 = 11, p-value = 0.266 |
| Variance Inflation Factors (Multicollinearity) |
> vif
        X1         X2         X3         X4         X5         X6
  1.584817   1.367862   1.054162   1.590980 195.393088 194.867967
|