| Multiple Linear Regression - Estimated Regression Equation |
| F1C[t] = + 2686.41 + 426.381M1[t] + 366.665M2[t] + 219.948M3[t] -248.435M4[t] -707.985M5[t] -899.535M6[t] -952.418M7[t] -1089.97M8[t] -1096.02M9[t] -798.4M10[t] -609.45M11[t] -4.9502t + e[t] |
| Multiple Linear Regression - Ordinary Least Squares | |||||
| Variable | Parameter | S.D. | T-STAT H0: parameter = 0 | 2-tail p-value | 1-tail p-value |
| (Intercept) | +2686 | 109.4 | +2.4550e+01 | 1.163e-32 | 5.815e-33 |
| M1 | +426.4 | 134 | +3.1820e+00 | 0.002332 | 0.001166 |
| M2 | +366.7 | 133.8 | +2.7390e+00 | 0.00813 | 0.004065 |
| M3 | +219.9 | 133.7 | +1.6450e+00 | 0.1053 | 0.05267 |
| M4 | -248.4 | 133.6 | -1.8590e+00 | 0.06797 | 0.03398 |
| M5 | -708 | 133.5 | -5.3030e+00 | 1.792e-06 | 8.961e-07 |
| M6 | -899.5 | 133.4 | -6.7420e+00 | 7.397e-09 | 3.698e-09 |
| M7 | -952.4 | 133.4 | -7.1420e+00 | 1.556e-09 | 7.782e-10 |
| M8 | -1090 | 133.3 | -8.1770e+00 | 2.75e-11 | 1.375e-11 |
| M9 | -1096 | 133.2 | -8.2250e+00 | 2.28e-11 | 1.14e-11 |
| M10 | -798.4 | 133.2 | -5.9930e+00 | 1.328e-07 | 6.639e-08 |
| M11 | -609.5 | 133.2 | -4.5750e+00 | 2.494e-05 | 1.247e-05 |
| t | -4.95 | 1.327 | -3.7310e+00 | 0.0004301 | 0.000215 |
| Multiple Linear Regression - Regression Statistics | |
| Multiple R | 0.9387 |
| R-squared | 0.8811 |
| Adjusted R-squared | 0.8569 |
| F-TEST (value) | 36.43 |
| F-TEST (DF numerator) | 12 |
| F-TEST (DF denominator) | 59 |
| p-value | 0 |
| Multiple Linear Regression - Residual Statistics | |
| Residual Standard Deviation | 230.7 |
| Sum Squared Residuals | 3.14e+06 |
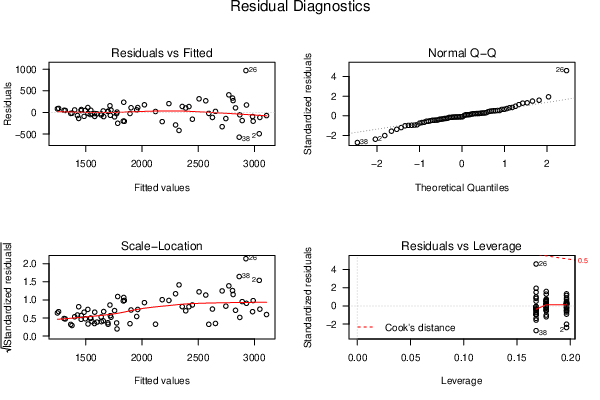
| Menu of Residual Diagnostics | |
| Description | Link |
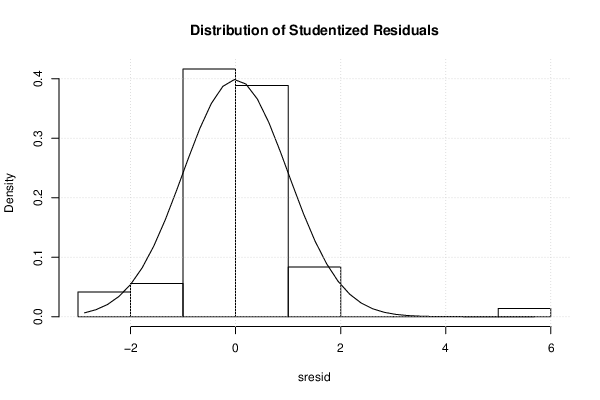
| Histogram | Compute |
| Central Tendency | Compute |
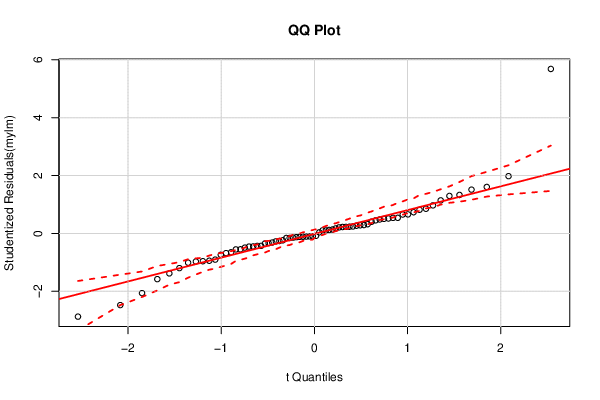
| QQ Plot | Compute |
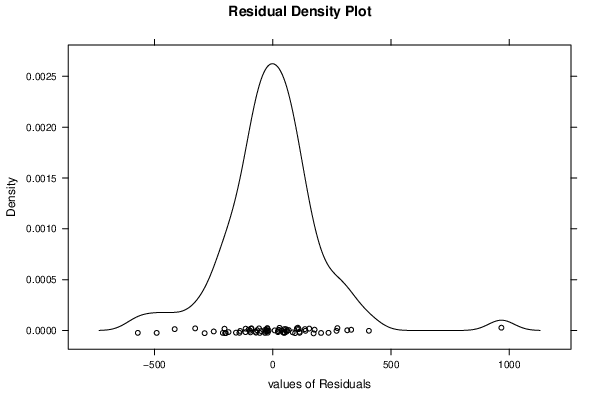
| Kernel Density Plot | Compute |
| Skewness/Kurtosis Test | Compute |
| Skewness-Kurtosis Plot | Compute |
| Harrell-Davis Plot | Compute |
| Bootstrap Plot -- Central Tendency | Compute |
| Blocked Bootstrap Plot -- Central Tendency | Compute |
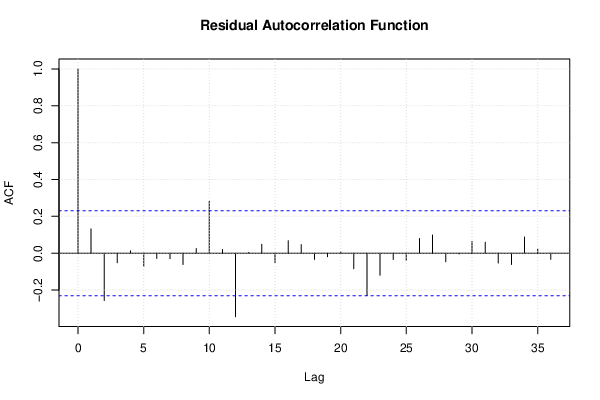
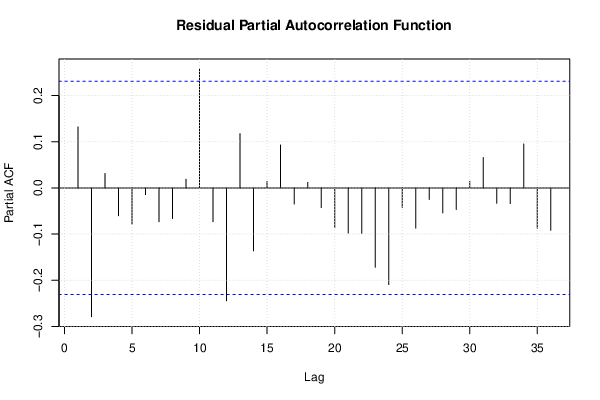
| (Partial) Autocorrelation Plot | Compute |
| Spectral Analysis | Compute |
| Tukey lambda PPCC Plot | Compute |
| Box-Cox Normality Plot | Compute |
| Summary Statistics | Compute |
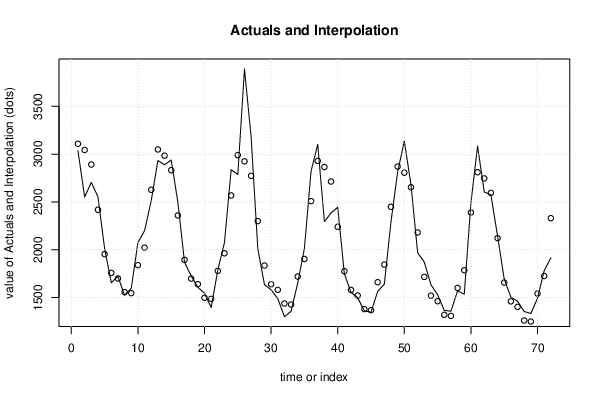
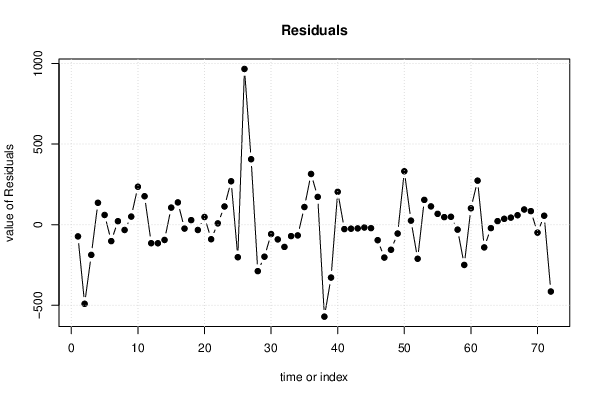
| Multiple Linear Regression - Actuals, Interpolation, and Residuals | |||
| Time or Index | Actuals | Interpolation Forecast | Residuals Prediction Error |
| 1 | 3035 | 3108 | -72.84 |
| 2 | 2552 | 3043 | -491.2 |
| 3 | 2704 | 2892 | -187.5 |
| 4 | 2554 | 2418 | 135.8 |
| 5 | 2014 | 1954 | 60.33 |
| 6 | 1655 | 1757 | -102.2 |
| 7 | 1721 | 1699 | 21.66 |
| 8 | 1524 | 1557 | -32.84 |
| 9 | 1596 | 1546 | 50.16 |
| 10 | 2074 | 1839 | 235.5 |
| 11 | 2199 | 2023 | 176.5 |
| 12 | 2512 | 2627 | -115 |
| 13 | 2933 | 3048 | -115.4 |
| 14 | 2889 | 2984 | -94.77 |
| 15 | 2938 | 2832 | 105.9 |
| 16 | 2497 | 2359 | 138.2 |
| 17 | 1870 | 1894 | -24.27 |
| 18 | 1726 | 1698 | 28.23 |
| 19 | 1607 | 1640 | -32.94 |
| 20 | 1545 | 1497 | 47.56 |
| 21 | 1396 | 1486 | -90.44 |
| 22 | 1787 | 1779 | 7.896 |
| 23 | 2076 | 1963 | 112.9 |
| 24 | 2837 | 2568 | 269.4 |
| 25 | 2787 | 2989 | -202 |
| 26 | 3891 | 2924 | 966.6 |
| 27 | 3179 | 2773 | 406.3 |
| 28 | 2011 | 2299 | -288.4 |
| 29 | 1636 | 1835 | -198.9 |
| 30 | 1580 | 1638 | -58.37 |
| 31 | 1489 | 1581 | -91.53 |
| 32 | 1300 | 1438 | -138 |
| 33 | 1356 | 1427 | -71.03 |
| 34 | 1653 | 1720 | -66.7 |
| 35 | 2013 | 1904 | 109.3 |
| 36 | 2823 | 2508 | 314.8 |
| 37 | 3102 | 2930 | 172.4 |
| 38 | 2294 | 2865 | -571 |
| 39 | 2385 | 2713 | -328.3 |
| 40 | 2444 | 2240 | 204 |
| 41 | 1748 | 1775 | -27.47 |
| 42 | 1554 | 1579 | -24.97 |
| 43 | 1498 | 1521 | -23.13 |
| 44 | 1361 | 1379 | -17.63 |
| 45 | 1346 | 1368 | -21.63 |
| 46 | 1564 | 1660 | -96.3 |
| 47 | 1640 | 1844 | -204.3 |
| 48 | 2293 | 2449 | -155.8 |
| 49 | 2815 | 2870 | -55.23 |
| 50 | 3137 | 2806 | 331.4 |
| 51 | 2679 | 2654 | 25.1 |
| 52 | 1969 | 2181 | -211.6 |
| 53 | 1870 | 1716 | 153.9 |
| 54 | 1633 | 1520 | 113.4 |
| 55 | 1529 | 1462 | 67.27 |
| 56 | 1366 | 1319 | 46.77 |
| 57 | 1357 | 1308 | 48.77 |
| 58 | 1570 | 1601 | -30.9 |
| 59 | 1535 | 1785 | -249.9 |
| 60 | 2491 | 2389 | 101.6 |
| 61 | 3084 | 2811 | 273.2 |
| 62 | 2605 | 2746 | -141.2 |
| 63 | 2573 | 2594 | -21.49 |
| 64 | 2143 | 2121 | 21.84 |
| 65 | 1693 | 1657 | 36.34 |
| 66 | 1504 | 1460 | 43.84 |
| 67 | 1461 | 1402 | 58.67 |
| 68 | 1354 | 1260 | 94.17 |
| 69 | 1333 | 1249 | 84.17 |
| 70 | 1492 | 1541 | -49.49 |
| 71 | 1781 | 1725 | 55.51 |
| 72 | 1915 | 2330 | -415 |
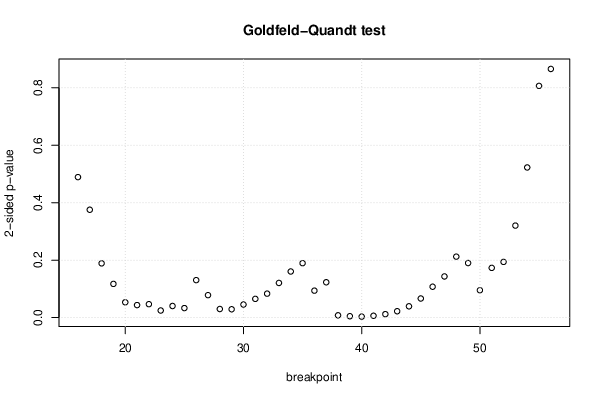
| Goldfeld-Quandt test for Heteroskedasticity | |||
| p-values | Alternative Hypothesis | ||
| breakpoint index | greater | 2-sided | less |
| 16 | 0.2445 | 0.4889 | 0.7555 |
| 17 | 0.1877 | 0.3754 | 0.8123 |
| 18 | 0.09442 | 0.1888 | 0.9056 |
| 19 | 0.05862 | 0.1172 | 0.9414 |
| 20 | 0.02661 | 0.05322 | 0.9734 |
| 21 | 0.02177 | 0.04354 | 0.9782 |
| 22 | 0.02335 | 0.04669 | 0.9767 |
| 23 | 0.01233 | 0.02465 | 0.9877 |
| 24 | 0.02016 | 0.04032 | 0.9798 |
| 25 | 0.01655 | 0.03309 | 0.9835 |
| 26 | 0.9348 | 0.1304 | 0.06519 |
| 27 | 0.9609 | 0.07812 | 0.03906 |
| 28 | 0.9851 | 0.02984 | 0.01492 |
| 29 | 0.9855 | 0.02897 | 0.01448 |
| 30 | 0.9773 | 0.04538 | 0.02269 |
| 31 | 0.9674 | 0.06514 | 0.03257 |
| 32 | 0.9583 | 0.0833 | 0.04165 |
| 33 | 0.9397 | 0.1206 | 0.06029 |
| 34 | 0.9197 | 0.1605 | 0.08025 |
| 35 | 0.9053 | 0.1894 | 0.09472 |
| 36 | 0.9532 | 0.09368 | 0.04684 |
| 37 | 0.9385 | 0.123 | 0.06149 |
| 38 | 0.9961 | 0.007883 | 0.003942 |
| 39 | 0.9976 | 0.004793 | 0.002397 |
| 40 | 0.9984 | 0.003253 | 0.001626 |
| 41 | 0.9969 | 0.006273 | 0.003137 |
| 42 | 0.994 | 0.01192 | 0.005961 |
| 43 | 0.9889 | 0.02215 | 0.01108 |
| 44 | 0.9804 | 0.03926 | 0.01963 |
| 45 | 0.9668 | 0.06644 | 0.03322 |
| 46 | 0.9463 | 0.1074 | 0.0537 |
| 47 | 0.9284 | 0.1432 | 0.07161 |
| 48 | 0.8939 | 0.2121 | 0.1061 |
| 49 | 0.9051 | 0.1899 | 0.09493 |
| 50 | 0.9524 | 0.0953 | 0.04765 |
| 51 | 0.9135 | 0.173 | 0.08652 |
| 52 | 0.9031 | 0.1938 | 0.0969 |
| 53 | 0.8399 | 0.3202 | 0.1601 |
| 54 | 0.7387 | 0.5226 | 0.2613 |
| 55 | 0.5968 | 0.8065 | 0.4032 |
| 56 | 0.4328 | 0.8655 | 0.5673 |
| Meta Analysis of Goldfeld-Quandt test for Heteroskedasticity | |||
| Description | # significant tests | % significant tests | OK/NOK |
| 1% type I error level | 4 | 0.09756 | NOK |
| 5% type I error level | 15 | 0.365854 | NOK |
| 10% type I error level | 22 | 0.536585 | NOK |
| Ramsey RESET F-Test for powers (2 and 3) of fitted values |
> reset_test_fitted RESET test data: mylm RESET = 3.1321, df1 = 2, df2 = 57, p-value = 0.05122 |
| Ramsey RESET F-Test for powers (2 and 3) of regressors |
> reset_test_regressors RESET test data: mylm RESET = 0.035537, df1 = 24, df2 = 35, p-value = 1 |
| Ramsey RESET F-Test for powers (2 and 3) of principal components |
> reset_test_principal_components RESET test data: mylm RESET = 0.69464, df1 = 2, df2 = 57, p-value = 0.5034 |
| Variance Inflation Factors (Multicollinearity) |
> vif
      M1       M2       M3       M4       M5       M6       M7       M8
1.855341 1.851521 1.848065 1.844974 1.842245 1.839881 1.837880 1.836243
      M9      M10      M11        t
1.834970 1.834061 1.833515 1.028373
|