| Multiple Linear Regression - Estimated Regression Equation |
| unit_price[t] = -2.69786 + 24.2184defl_price[t] -2.66691dum[t] + 8.06119e-06barrels_purchased[t] + 1.25342`unit_price(t-1)`[t] -0.553035`unit_price(t-2)`[t] + 0.155801`unit_price(t-3)`[t] + 0.0384046`unit_price(t-1s)`[t] + e[t] |
| Multiple Linear Regression - Ordinary Least Squares | |||||
| Variable | Parameter | S.D. | T-STAT H0: parameter = 0 | 2-tail p-value | 1-tail p-value |
| (Intercept) | -2.698 | 0.4056 | -6.6520e+00 | 9.587e-11 | 4.793e-11 |
| defl_price | +24.22 | 2.772 | +8.7380e+00 | 6.762e-17 | 3.381e-17 |
| dum | -2.667 | 0.3665 | -7.2760e+00 | 1.852e-12 | 9.258e-13 |
| barrels_purchased | +8.061e-06 | 1.469e-06 | +5.4880e+00 | 7.278e-08 | 3.639e-08 |
| `unit_price(t-1)` | +1.253 | 0.05231 | +2.3960e+01 | 4.022e-79 | 2.011e-79 |
| `unit_price(t-2)` | -0.553 | 0.0776 | -7.1270e+00 | 4.876e-12 | 2.438e-12 |
| `unit_price(t-3)` | +0.1558 | 0.04806 | +3.2420e+00 | 0.001289 | 0.0006443 |
| `unit_price(t-1s)` | +0.03841 | 0.01422 | +2.7010e+00 | 0.007208 | 0.003604 |
| Multiple Linear Regression - Regression Statistics | |
| Multiple R | 0.9949 |
| R-squared | 0.9899 |
| Adjusted R-squared | 0.9897 |
| F-TEST (value) | 5556 |
| F-TEST (DF numerator) | 7 |
| F-TEST (DF denominator) | 397 |
| p-value | 0 |
| Multiple Linear Regression - Residual Statistics | |
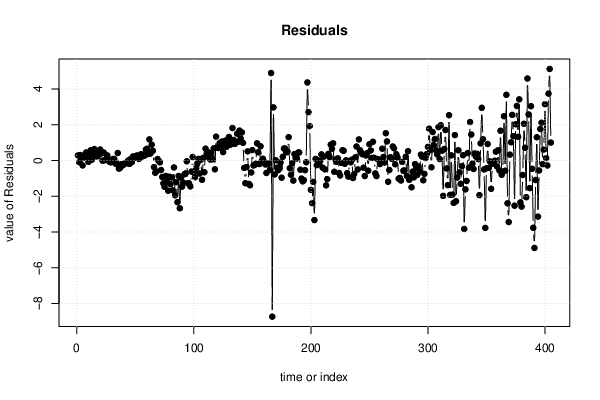
| Residual Standard Deviation | 1.315 |
| Sum Squared Residuals | 686 |
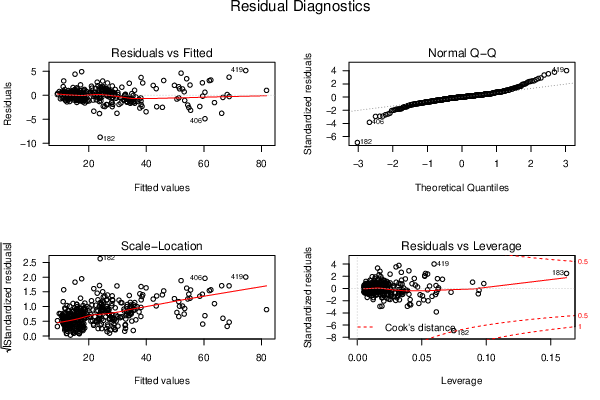
| Menu of Residual Diagnostics | |
| Description | Link |
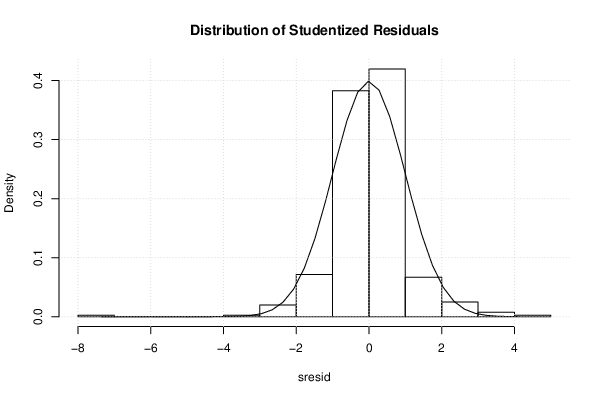
| Histogram | Compute |
| Central Tendency | Compute |
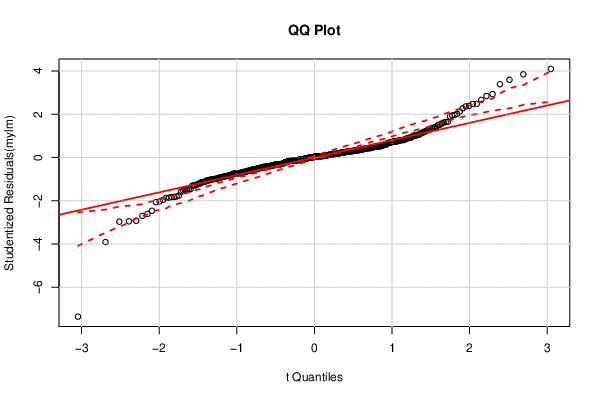
| QQ Plot | Compute |
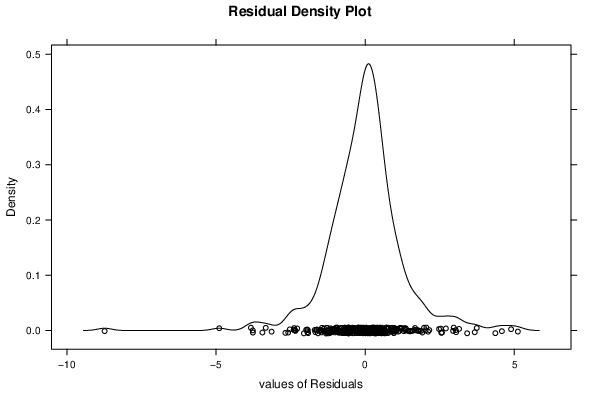
| Kernel Density Plot | Compute |
| Skewness/Kurtosis Test | Compute |
| Skewness-Kurtosis Plot | Compute |
| Harrell-Davis Plot | Compute |
| Bootstrap Plot -- Central Tendency | Compute |
| Blocked Bootstrap Plot -- Central Tendency | Compute |
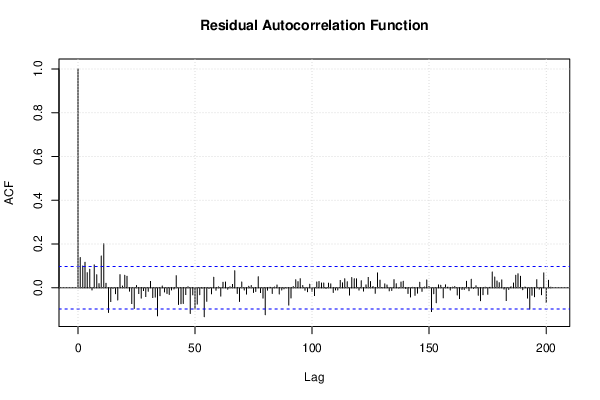
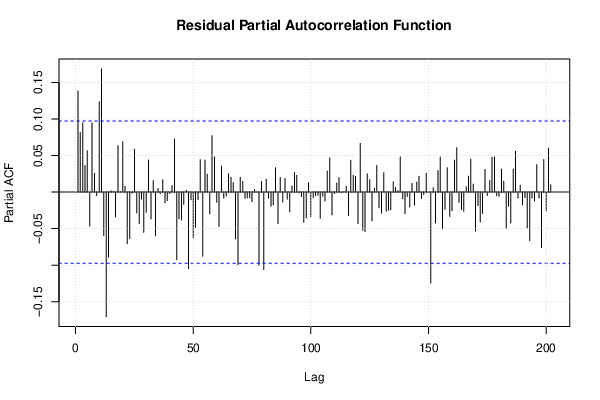
| (Partial) Autocorrelation Plot | Compute |
| Spectral Analysis | Compute |
| Tukey lambda PPCC Plot | Compute |
| Box-Cox Normality Plot | Compute |
| Summary Statistics | Compute |
| Ramsey RESET F-Test for powers (2 and 3) of fitted values |
> reset_test_fitted RESET test data: mylm RESET = 6.2407, df1 = 2, df2 = 395, p-value = 0.002146 |
| Ramsey RESET F-Test for powers (2 and 3) of regressors |
> reset_test_regressors RESET test data: mylm RESET = 7.6349, df1 = 14, df2 = 383, p-value = 3.125e-14 |
| Ramsey RESET F-Test for powers (2 and 3) of principal components |
> reset_test_principal_components RESET test data: mylm RESET = 2.1205, df1 = 2, df2 = 395, p-value = 0.1213 |
| Variance Inflation Factors (Multicollinearity) |
> vif
        defl_price                dum  barrels_purchased  `unit_price(t-1)`
         14.005872           7.237338           2.469524         102.147624
 `unit_price(t-2)`  `unit_price(t-3)` `unit_price(t-1s)`
        214.298365          79.273268           5.798118
|