| Multiple Linear Regression - Estimated Regression Equation |
| defl_price[t] = + 0.00203264 + 1.45385defl_price1[t] -0.46843defl_price2[t] -0.0783325defl_price3[t] + 0.0807523defl_price4[t] + 4.03107e-08barrels1[t] -1.82965e-09barrels2[t] + 1.38662e-09barrels3[t] + 4.11059e-10barrels4[t] -8.07214e-11barrels12[t] + 7.97501e-10barrels24[t] + 0.000508593dum[t] -0.000153128US_IND_PROD[t] + e[t] |
| Warning: you did not specify the column number of the endogenous series! The first column was selected by default. |
| Multiple Linear Regression - Ordinary Least Squares | |||||
| Variable | Parameter | S.D. | T-STAT H0: parameter = 0 | 2-tail p-value | 1-tail p-value |
| (Intercept) | +0.002033 | 0.005508 | +3.6910e-01 | 0.7123 | 0.3561 |
| defl_price1 | +1.454 | 0.05843 | +2.4880e+01 | 5.174e-82 | 2.587e-82 |
| defl_price2 | -0.4684 | 0.09416 | -4.9750e+00 | 9.886e-07 | 4.943e-07 |
| defl_price3 | -0.07833 | 0.09522 | -8.2270e-01 | 0.4112 | 0.2056 |
| defl_price4 | +0.08075 | 0.05349 | +1.5100e+00 | 0.132 | 0.06598 |
| barrels1 | +4.031e-08 | 1.863e-08 | +2.1640e+00 | 0.03108 | 0.01554 |
| barrels2 | -1.83e-09 | 9.305e-10 | -1.9660e+00 | 0.04999 | 0.025 |
| barrels3 | +1.387e-09 | 9.289e-10 | +1.4930e+00 | 0.1363 | 0.06817 |
| barrels4 | +4.111e-10 | 8.611e-10 | +4.7730e-01 | 0.6334 | 0.3167 |
| barrels12 | -8.072e-11 | 4.897e-10 | -1.6480e-01 | 0.8692 | 0.4346 |
| barrels24 | +7.975e-10 | 4.552e-10 | +1.7520e+00 | 0.08058 | 0.04029 |
| dum | +0.0005086 | 0.002706 | +1.8800e-01 | 0.851 | 0.4255 |
| US_IND_PROD | -0.0001531 | 8.59e-05 | -1.7830e+00 | 0.07545 | 0.03773 |
| Multiple Linear Regression - Regression Statistics | |
| Multiple R | 0.9942 |
| R-squared | 0.9884 |
| Adjusted R-squared | 0.9881 |
| F-TEST (value) | 2725 |
| F-TEST (DF numerator) | 12 |
| F-TEST (DF denominator) | 383 |
| p-value | 0 |
| Multiple Linear Regression - Residual Statistics | |
| Residual Standard Deviation | 0.009726 |
| Sum Squared Residuals | 0.03623 |
| Menu of Residual Diagnostics | |
| Description | Link |
| Histogram | Compute |
| Central Tendency | Compute |
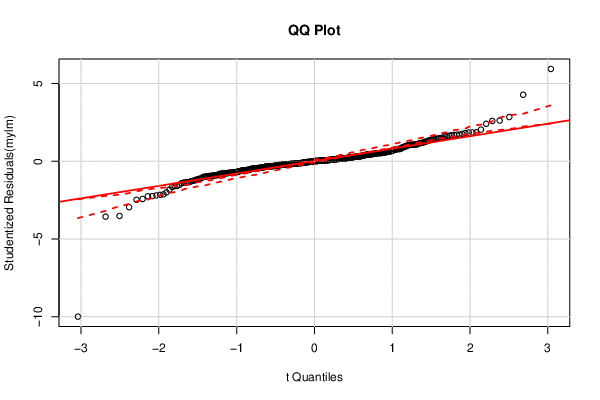
| QQ Plot | Compute |
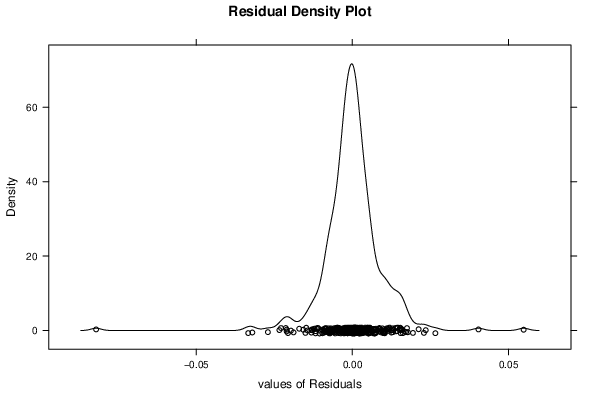
| Kernel Density Plot | Compute |
| Skewness/Kurtosis Test | Compute |
| Skewness-Kurtosis Plot | Compute |
| Harrell-Davis Plot | Compute |
| Bootstrap Plot -- Central Tendency | Compute |
| Blocked Bootstrap Plot -- Central Tendency | Compute |
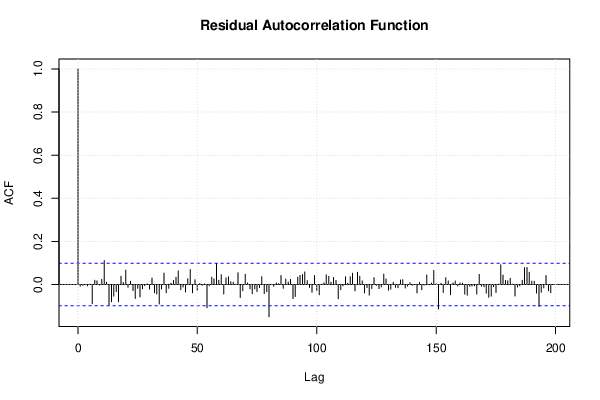
| (Partial) Autocorrelation Plot | Compute |
| Spectral Analysis | Compute |
| Tukey lambda PPCC Plot | Compute |
| Box-Cox Normality Plot | Compute |
| Summary Statistics | Compute |
| Ramsey RESET F-Test for powers (2 and 3) of fitted values |
> reset_test_fitted RESET test data: mylm RESET = 1.1917, df1 = 2, df2 = 381, p-value = 0.3048 |
| Ramsey RESET F-Test for powers (2 and 3) of regressors |
> reset_test_regressors RESET test data: mylm RESET = 1.5827, df1 = 24, df2 = 359, p-value = 0.04182 |
| Ramsey RESET F-Test for powers (2 and 3) of principal components |
> reset_test_principal_components RESET test data: mylm RESET = 2.0862, df1 = 2, df2 = 381, p-value = 0.1256 |
| Variance Inflation Factors (Multicollinearity) |
> vif defl_price1 defl_price2 defl_price3 defl_price4 barrels1 barrels2 111.471119 286.276109 290.456998 91.117515 7.043785 69.353073 barrels3 barrels4 barrels12 barrels24 dum US_IND_PROD 65.951905 54.295466 13.904274 7.420247 6.910256 11.017479 |