| Multiple Linear Regression - Estimated Regression Equation |
| barrels_purchased[t] = -24518.8 -159.417cpi[t] -292.582unit_price[t] + 862.398US_IND_PROD[t] + 0.347273`barrels_purchased(t-1)`[t] + 0.334244`barrels_purchased(t-2)`[t] + 0.196889`barrels_purchased(t-1s)`[t] + 20412.3M1[t] + 28237.9M2[t] + 25141.6M3[t] + 23362M4[t] + 23270.6M5[t] + 23748.2M6[t] + 11716.4M7[t] + 18047.6M8[t] + 12716.4M9[t] + 13935.3M10[t] + 23745.4M11[t] + e[t] |
| Multiple Linear Regression - Ordinary Least Squares | |||||
| Variable | Parameter | S.D. | T-STAT H0: parameter = 0 | 2-tail p-value | 1-tail p-value |
| (Intercept) | -2.452e+04 | 5182 | -4.7310e+00 | 3.131e-06 | 1.566e-06 |
| cpi | -159.4 | 73.41 | -2.1720e+00 | 0.0305 | 0.01525 |
| unit_price | -292.6 | 79 | -3.7040e+00 | 0.0002434 | 0.0001217 |
| US_IND_PROD | +862.4 | 247.6 | +3.4840e+00 | 0.0005511 | 0.0002756 |
| `barrels_purchased(t-1)` | +0.3473 | 0.04774 | +7.2750e+00 | 1.935e-12 | 9.674e-13 |
| `barrels_purchased(t-2)` | +0.3342 | 0.04638 | +7.2070e+00 | 3.012e-12 | 1.506e-12 |
| `barrels_purchased(t-1s)` | +0.1969 | 0.03865 | +5.0950e+00 | 5.468e-07 | 2.734e-07 |
| M1 | +2.041e+04 | 4460 | +4.5770e+00 | 6.371e-06 | 3.185e-06 |
| M2 | +2.824e+04 | 4347 | +6.4950e+00 | 2.54e-10 | 1.27e-10 |
| M3 | +2.514e+04 | 4278 | +5.8770e+00 | 9.023e-09 | 4.511e-09 |
| M4 | +2.336e+04 | 4258 | +5.4860e+00 | 7.418e-08 | 3.709e-08 |
| M5 | +2.327e+04 | 4268 | +5.4530e+00 | 8.846e-08 | 4.423e-08 |
| M6 | +2.375e+04 | 4292 | +5.5330e+00 | 5.797e-08 | 2.899e-08 |
| M7 | +1.172e+04 | 4190 | +2.7970e+00 | 0.005422 | 0.002711 |
| M8 | +1.805e+04 | 4297 | +4.2000e+00 | 3.311e-05 | 1.655e-05 |
| M9 | +1.272e+04 | 4168 | +3.0510e+00 | 0.002435 | 0.001217 |
| M10 | +1.394e+04 | 4228 | +3.2960e+00 | 0.001071 | 0.0005353 |
| M11 | +2.374e+04 | 4297 | +5.5260e+00 | 6.036e-08 | 3.018e-08 |
| Multiple Linear Regression - Regression Statistics | |
| Multiple R | 0.9719 |
| R-squared | 0.9446 |
| Adjusted R-squared | 0.9422 |
| F-TEST (value) | 389.3 |
| F-TEST (DF numerator) | 17 |
| F-TEST (DF denominator) | 388 |
| p-value | 0 |
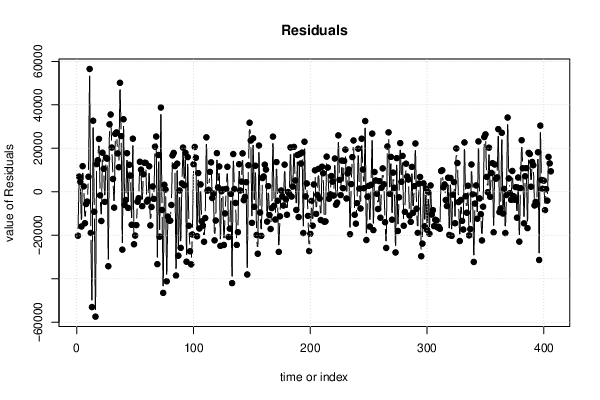
| Multiple Linear Regression - Residual Statistics | |
| Residual Standard Deviation | 1.686e+04 |
| Sum Squared Residuals | 1.103e+11 |
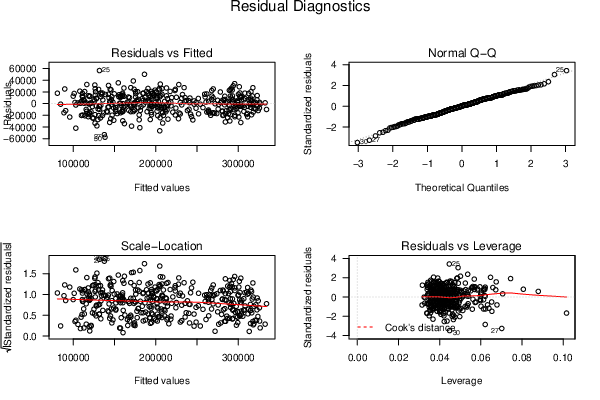
| Menu of Residual Diagnostics | |
| Description | Link |
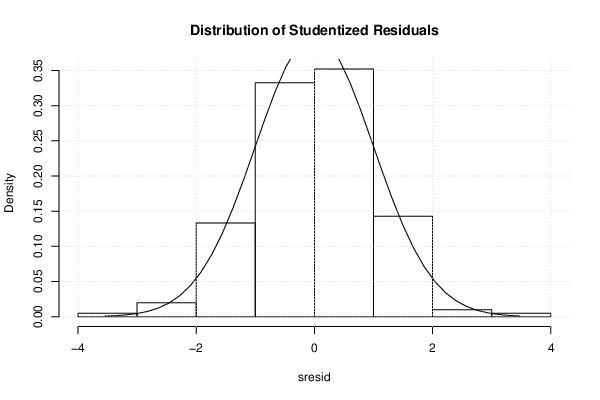
| Histogram | Compute |
| Central Tendency | Compute |
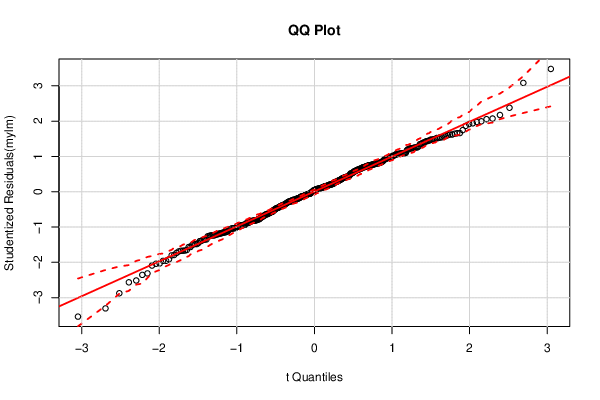
| QQ Plot | Compute |
| Kernel Density Plot | Compute |
| Skewness/Kurtosis Test | Compute |
| Skewness-Kurtosis Plot | Compute |
| Harrell-Davis Plot | Compute |
| Bootstrap Plot -- Central Tendency | Compute |
| Blocked Bootstrap Plot -- Central Tendency | Compute |
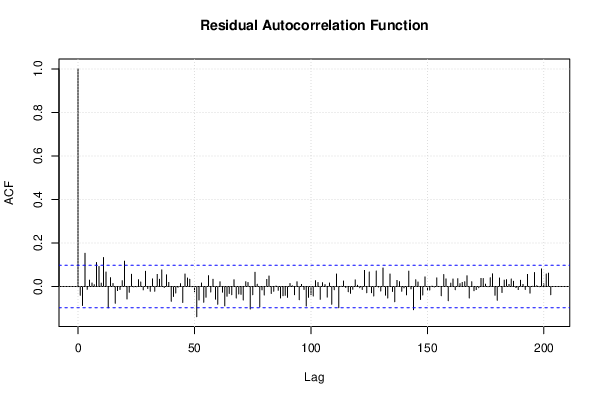
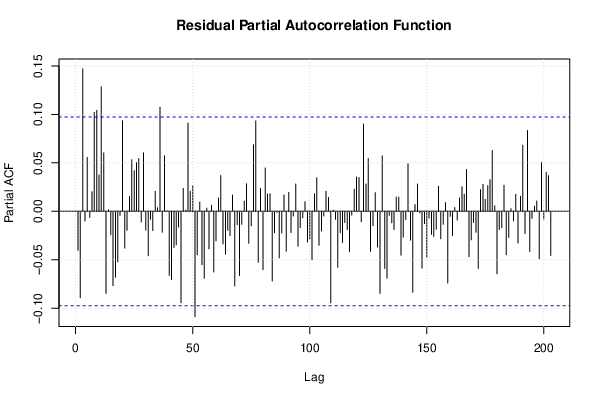
| (Partial) Autocorrelation Plot | Compute |
| Spectral Analysis | Compute |
| Tukey lambda PPCC Plot | Compute |
| Box-Cox Normality Plot | Compute |
| Summary Statistics | Compute |
| Ramsey RESET F-Test for powers (2 and 3) of fitted values |
> reset_test_fitted RESET test data: mylm RESET = 0.51357, df1 = 2, df2 = 386, p-value = 0.5988 |
| Ramsey RESET F-Test for powers (2 and 3) of regressors |
> reset_test_regressors RESET test data: mylm RESET = 1.0519, df1 = 34, df2 = 354, p-value = 0.3935 |
| Ramsey RESET F-Test for powers (2 and 3) of principal components |
> reset_test_principal_components RESET test data: mylm RESET = 0.51047, df1 = 2, df2 = 386, p-value = 0.6006 |
| Variance Inflation Factors (Multicollinearity) |
> vif
                      cpi                unit_price               US_IND_PROD
                15.987777                  1.493721                 31.690502
 `barrels_purchased(t-1)`  `barrels_purchased(t-2)` `barrels_purchased(t-1s)`
                16.015475                 15.143902                 10.336480
                       M1                        M2                        M3
                 2.180003                  2.071123                  2.005805
                       M4                        M5                        M6
                 1.987101                  1.995945                  2.018745
                       M7                        M8                        M9
                 1.923586                  2.023276                  1.903321
                      M10                       M11
                 1.958816                  1.969603
|