| Multiple Linear Regression - Estimated Regression Equation |
| barrels_purchased[t] = -19242 -295.764unit_price[t] + 268.903dum[t] + 390.741US_IND_PROD[t] + 0.362847`barrels_purchased(t-1)`[t] + 0.346738`barrels_purchased(t-2)`[t] + 0.203354`barrels_purchased(t-1s)`[t] + 20739.4M1[t] + 28552.5M2[t] + 25105.6M3[t] + 23106.2M4[t] + 22847.5M5[t] + 23231M6[t] + 11142.1M7[t] + 17623.2M8[t] + 12494.6M9[t] + 13895.2M10[t] + 23684.3M11[t] + e[t] |
| Multiple Linear Regression - Ordinary Least Squares | |||||
| Variable | Parameter | S.D. | T-STAT H0: parameter = 0 | 2-tail p-value | 1-tail p-value |
| (Intercept) | -1.924e+04 | 7442 | -2.5850e+00 | 0.01009 | 0.005045 |
| unit_price | -295.8 | 92.84 | -3.1860e+00 | 0.001561 | 0.0007803 |
| dum | +268.9 | 3290 | +8.1740e-02 | 0.9349 | 0.4674 |
| US_IND_PROD | +390.7 | 155.9 | +2.5060e+00 | 0.01261 | 0.006306 |
| `barrels_purchased(t-1)` | +0.3629 | 0.04752 | +7.6360e+00 | 1.761e-13 | 8.803e-14 |
| `barrels_purchased(t-2)` | +0.3467 | 0.04632 | +7.4850e+00 | 4.833e-13 | 2.417e-13 |
| `barrels_purchased(t-1s)` | +0.2034 | 0.03915 | +5.1940e+00 | 3.323e-07 | 1.662e-07 |
| M1 | +2.074e+04 | 4485 | +4.6250e+00 | 5.12e-06 | 2.56e-06 |
| M2 | +2.855e+04 | 4371 | +6.5320e+00 | 2.044e-10 | 1.022e-10 |
| M3 | +2.511e+04 | 4309 | +5.8260e+00 | 1.195e-08 | 5.975e-09 |
| M4 | +2.311e+04 | 4290 | +5.3860e+00 | 1.249e-07 | 6.243e-08 |
| M5 | +2.285e+04 | 4299 | +5.3140e+00 | 1.809e-07 | 9.046e-08 |
| M6 | +2.323e+04 | 4325 | +5.3720e+00 | 1.346e-07 | 6.73e-08 |
| M7 | +1.114e+04 | 4217 | +2.6420e+00 | 0.008565 | 0.004282 |
| M8 | +1.762e+04 | 4328 | +4.0720e+00 | 5.651e-05 | 2.826e-05 |
| M9 | +1.25e+04 | 4196 | +2.9780e+00 | 0.003088 | 0.001544 |
| M10 | +1.39e+04 | 4256 | +3.2650e+00 | 0.001192 | 0.0005961 |
| M11 | +2.368e+04 | 4326 | +5.4750e+00 | 7.868e-08 | 3.934e-08 |
| Multiple Linear Regression - Regression Statistics | |
| Multiple R | 0.9716 |
| R-squared | 0.9439 |
| Adjusted R-squared | 0.9415 |
| F-TEST (value) | 384.4 |
| F-TEST (DF numerator) | 17 |
| F-TEST (DF denominator) | 388 |
| p-value | 0 |
| Multiple Linear Regression - Residual Statistics | |
| Residual Standard Deviation | 1.696e+04 |
| Sum Squared Residuals | 1.116e+11 |
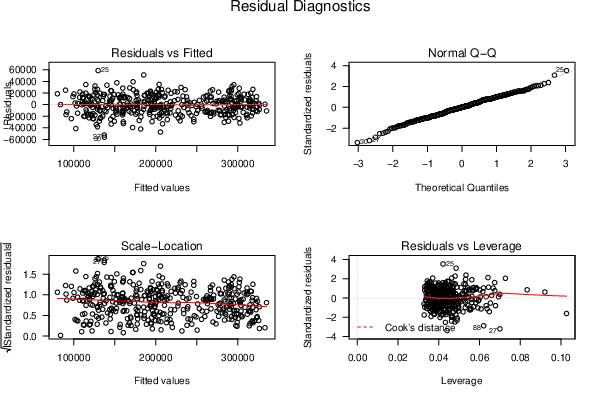
| Menu of Residual Diagnostics | |
| Description | Link |
| Histogram | Compute |
| Central Tendency | Compute |
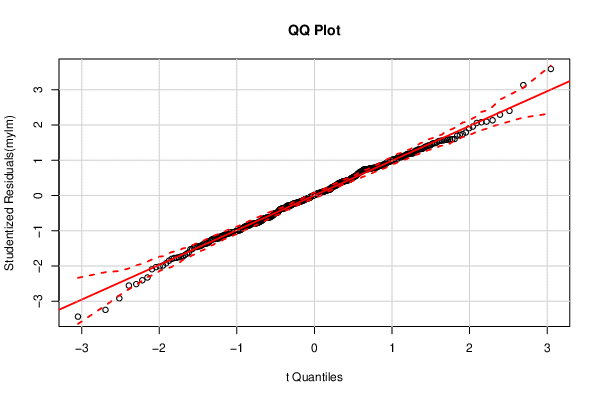
| QQ Plot | Compute |
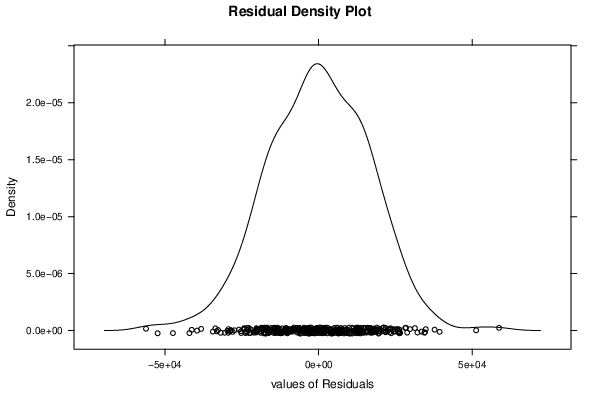
| Kernel Density Plot | Compute |
| Skewness/Kurtosis Test | Compute |
| Skewness-Kurtosis Plot | Compute |
| Harrell-Davis Plot | Compute |
| Bootstrap Plot -- Central Tendency | Compute |
| Blocked Bootstrap Plot -- Central Tendency | Compute |
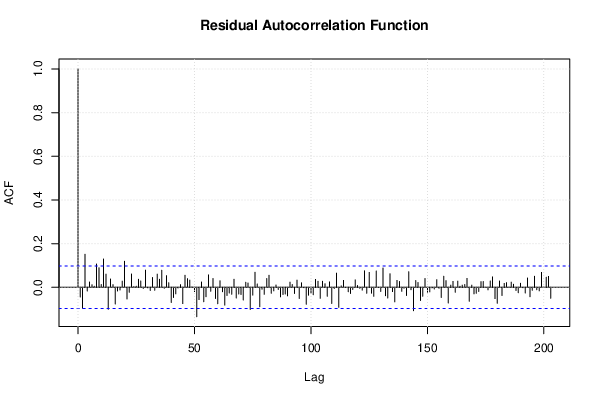
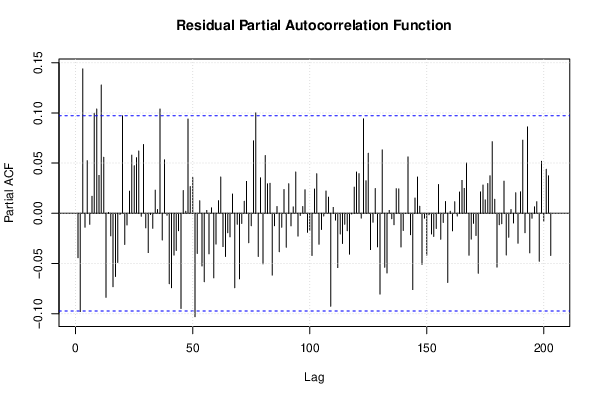
| (Partial) Autocorrelation Plot | Compute |
| Spectral Analysis | Compute |
| Tukey lambda PPCC Plot | Compute |
| Box-Cox Normality Plot | Compute |
| Summary Statistics | Compute |
| Ramsey RESET F-Test for powers (2 and 3) of fitted values |
> reset_test_fitted RESET test data: mylm RESET = 0.007783, df1 = 2, df2 = 386, p-value = 0.9922 |
| Ramsey RESET F-Test for powers (2 and 3) of regressors |
> reset_test_regressors RESET test data: mylm RESET = 0.59647, df1 = 34, df2 = 354, p-value = 0.9658 |
| Ramsey RESET F-Test for powers (2 and 3) of principal components |
> reset_test_principal_components RESET test data: mylm RESET = 0.038841, df1 = 2, df2 = 386, p-value = 0.9619 |
| Variance Inflation Factors (Multicollinearity) |
> vif
               unit_price                       dum               US_IND_PROD
                 2.038244                  3.517158                 12.418907
 `barrels_purchased(t-1)`  `barrels_purchased(t-2)` `barrels_purchased(t-1s)`
                15.678477                 14.924917                 10.479343
                       M1                        M2                        M3
                 2.177529                  2.069024                  2.010739
                       M4                        M5                        M6
                 1.992411                  2.001242                  2.024911
                       M7                        M8                        M9
                 1.925100                  2.028035                  1.906562
                      M10                       M11
                 1.961163                  1.971781
|