| Multiple Linear Regression - Estimated Regression Equation |
| barrels_purchased[t] = + 64646.8 -440020defl_price[t] + 197852defl_pricedum[t] + 0.00684709total_value[t] + 0.271577`barrels_purchased(t-1)`[t] + 0.27762`barrels_purchased(t-2)`[t] + 0.217994`barrels_purchased(t-1s)`[t] + 15315.1M1[t] + 22104.7M2[t] + 19720.7M3[t] + 17832.1M4[t] + 18020M5[t] + 17898.5M6[t] + 9379.88M7[t] + 13974.3M8[t] + 10109.2M9[t] + 10861.5M10[t] + 19493.7M11[t] + e[t] |
| Multiple Linear Regression - Ordinary Least Squares | |||||
| Variable | Parameter | S.D. | T-STAT H0: parameter = 0 | 2-tail p-value | 1-tail p-value |
| (Intercept) | +6.465e+04 | 8211 | +7.8730e+00 | 3.494e-14 | 1.747e-14 |
| defl_price | -4.4e+05 | 4.622e+04 | -9.5210e+00 | 1.881e-19 | 9.403e-20 |
| defl_pricedum | +1.978e+05 | 2.571e+04 | +7.6950e+00 | 1.182e-13 | 5.912e-14 |
| total_value | +0.006847 | 0.0007186 | +9.5280e+00 | 1.777e-19 | 8.883e-20 |
| `barrels_purchased(t-1)` | +0.2716 | 0.0436 | +6.2290e+00 | 1.223e-09 | 6.116e-10 |
| `barrels_purchased(t-2)` | +0.2776 | 0.04206 | +6.6010e+00 | 1.347e-10 | 6.735e-11 |
| `barrels_purchased(t-1s)` | +0.218 | 0.03426 | +6.3630e+00 | 5.573e-10 | 2.787e-10 |
| M1 | +1.532e+04 | 4074 | +3.7590e+00 | 0.0001966 | 9.83e-05 |
| M2 | +2.21e+04 | 3989 | +5.5420e+00 | 5.532e-08 | 2.766e-08 |
| M3 | +1.972e+04 | 3899 | +5.0580e+00 | 6.55e-07 | 3.275e-07 |
| M4 | +1.783e+04 | 3867 | +4.6120e+00 | 5.432e-06 | 2.716e-06 |
| M5 | +1.802e+04 | 3856 | +4.6730e+00 | 4.098e-06 | 2.049e-06 |
| M6 | +1.79e+04 | 3870 | +4.6260e+00 | 5.098e-06 | 2.549e-06 |
| M7 | +9380 | 3759 | +2.4950e+00 | 0.01301 | 0.006504 |
| M8 | +1.397e+04 | 3874 | +3.6070e+00 | 0.0003501 | 0.0001751 |
| M9 | +1.011e+04 | 3768 | +2.6830e+00 | 0.007608 | 0.003804 |
| M10 | +1.086e+04 | 3833 | +2.8340e+00 | 0.004839 | 0.002419 |
| M11 | +1.949e+04 | 3905 | +4.9920e+00 | 9.063e-07 | 4.532e-07 |
| Multiple Linear Regression - Regression Statistics | |
| Multiple R | 0.977 |
| R-squared | 0.9546 |
| Adjusted R-squared | 0.9526 |
| F-TEST (value) | 479.9 |
| F-TEST (DF numerator) | 17 |
| F-TEST (DF denominator) | 388 |
| p-value | 0 |
| Multiple Linear Regression - Residual Statistics | |
| Residual Standard Deviation | 1.527e+04 |
| Sum Squared Residuals | 9.041e+10 |
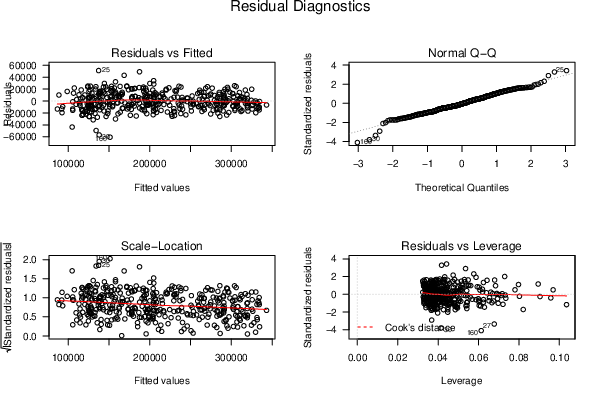
| Menu of Residual Diagnostics | |
| Description | Link |
| Histogram | Compute |
| Central Tendency | Compute |
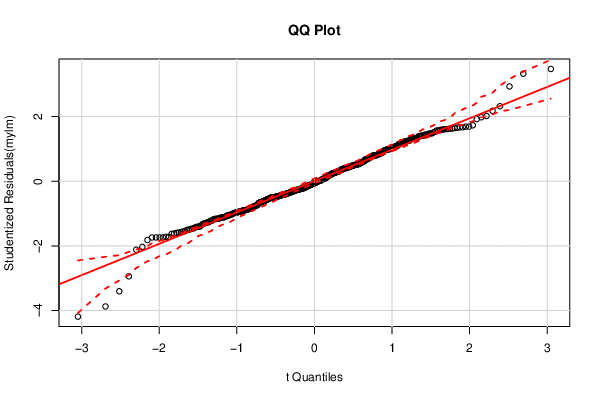
| QQ Plot | Compute |
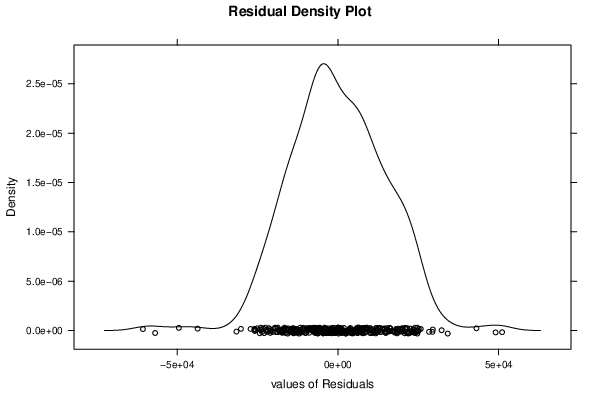
| Kernel Density Plot | Compute |
| Skewness/Kurtosis Test | Compute |
| Skewness-Kurtosis Plot | Compute |
| Harrell-Davis Plot | Compute |
| Bootstrap Plot -- Central Tendency | Compute |
| Blocked Bootstrap Plot -- Central Tendency | Compute |
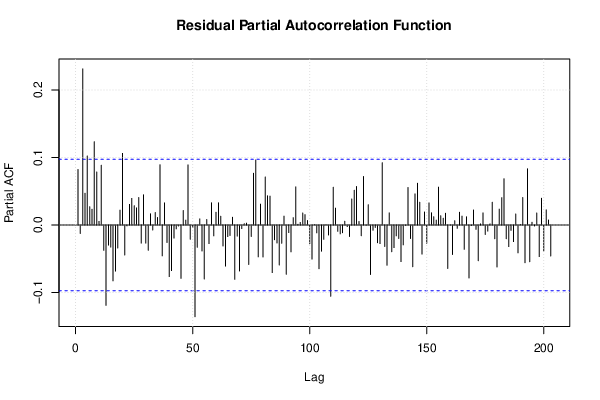
| (Partial) Autocorrelation Plot | Compute |
| Spectral Analysis | Compute |
| Tukey lambda PPCC Plot | Compute |
| Box-Cox Normality Plot | Compute |
| Summary Statistics | Compute |
| Ramsey RESET F-Test for powers (2 and 3) of fitted values |
> reset_test_fitted RESET test data: mylm RESET = 7.1205, df1 = 2, df2 = 386, p-value = 0.000919 |
| Ramsey RESET F-Test for powers (2 and 3) of regressors |
> reset_test_regressors RESET test data: mylm RESET = 3.8993, df1 = 34, df2 = 354, p-value = 3.982e-11 |
| Ramsey RESET F-Test for powers (2 and 3) of principal components |
> reset_test_principal_components RESET test data: mylm RESET = 32.397, df1 = 2, df2 = 386, p-value = 9.854e-14 |
| Variance Inflation Factors (Multicollinearity) |
> vif
               defl_price             defl_pricedum               total_value
                28.890558                 21.274305                 17.924218
 `barrels_purchased(t-1)`  `barrels_purchased(t-2)` `barrels_purchased(t-1s)`
                16.298513                 15.192997                  9.908485
                       M1                        M2                        M3
                 2.218785                  2.126833                  2.032309
                       M4                        M5                        M6
                 1.998870                  1.987864                  2.001699
                       M7                        M8                        M9
                 1.889428                  2.006532                  1.897894
                      M10                       M11
                 1.963857                  1.984312
|