| Pearson Product Moment Correlation - Ungrouped Data | ||
| Statistic | Variable X | Variable Y |
| Mean | 3.39473684210526 | 9.49631578947368 |
| Biased Variance | 1.06260387811634 | 21.1589390581717 |
| Biased Standard Deviation | 1.03082679346064 | 4.59988467879052 |
| Covariance | -2.91268713450292 | |
| Correlation | -0.581942532262186 | |
| Determination | 0.338657110855725 | |
| T-Test | -2.95047008759593 | |
| p-value (2 sided) | 0.00895046317220369 | |
| p-value (1 sided) | 0.00447523158610184 | |
| 95% CI of Correlation | [-0.819530486356243, -0.173626969176024] | |
| Degrees of Freedom | 17 | |
| Number of Observations | 19 | |
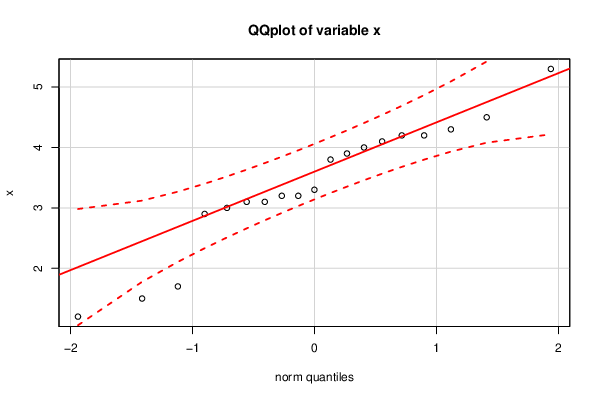
| Normality Tests |
> jarque.x Jarque-Bera Normality Test data: x JB = 1.014, p-value = 0.6023 alternative hypothesis: greater |
> jarque.y Jarque-Bera Normality Test data: y JB = 1.1102, p-value = 0.574 alternative hypothesis: greater |
> ad.x Anderson-Darling normality test data: x A = 0.5709, p-value = 0.119 |
> ad.y Anderson-Darling normality test data: y A = 0.23987, p-value = 0.7419 |