| Multiple Linear Regression - Estimated Regression Equation |
| barrels_purchased[t] = -7865.76 -313.646unit_price[t] + 573.881US_IND_PROD[t] + 56334.5defl_price1[t] -99865.8defl_price2[t] + 62883.8defl_price3[t] + 0.37907`barrels_purchased(t-1)`[t] + 0.3068`barrels_purchased(t-2)`[t] + 0.179869`barrels_purchased(t-3)`[t] + e[t] |
| Multiple Linear Regression - Ordinary Least Squares | |||||
| Variable | Parameter | S.D. | T-STAT H0: parameter = 0 | 2-tail p-value | 1-tail p-value |
| (Intercept) | -7866 | 9675 | -8.1300e-01 | 0.4167 | 0.2083 |
| unit_price | -313.6 | 229.1 | -1.3690e+00 | 0.1717 | 0.08586 |
| US_IND_PROD | +573.9 | 193.5 | +2.9660e+00 | 0.003193 | 0.001597 |
| defl_price1 | +5.633e+04 | 1.075e+05 | +5.2410e-01 | 0.6005 | 0.3002 |
| defl_price2 | -9.987e+04 | 1.674e+05 | -5.9650e-01 | 0.5512 | 0.2756 |
| defl_price3 | +6.288e+04 | 9.85e+04 | +6.3840e-01 | 0.5235 | 0.2618 |
| `barrels_purchased(t-1)` | +0.3791 | 0.04898 | +7.7390e+00 | 8.084e-14 | 4.042e-14 |
| `barrels_purchased(t-2)` | +0.3068 | 0.05019 | +6.1130e+00 | 2.305e-09 | 1.153e-09 |
| `barrels_purchased(t-3)` | +0.1799 | 0.04916 | +3.6590e+00 | 0.0002867 | 0.0001434 |
| Multiple Linear Regression - Regression Statistics | |
| Multiple R | 0.9622 |
| R-squared | 0.9259 |
| Adjusted R-squared | 0.9244 |
| F-TEST (value) | 632.2 |
| F-TEST (DF numerator) | 8 |
| F-TEST (DF denominator) | 405 |
| p-value | 0 |
| Multiple Linear Regression - Residual Statistics | |
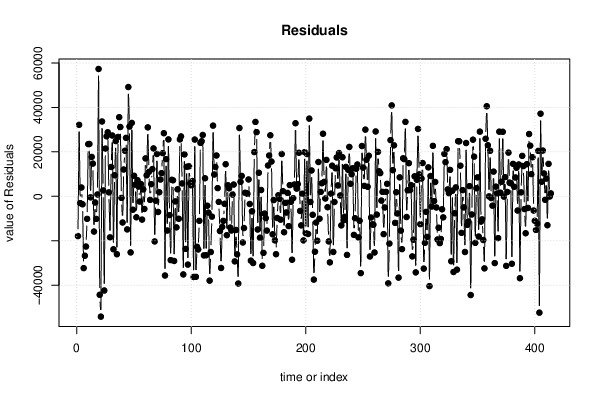
| Residual Standard Deviation | 1.943e+04 |
| Sum Squared Residuals | 1.53e+11 |
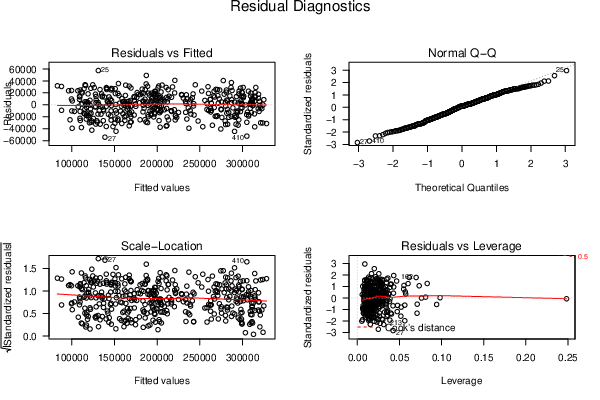
| Menu of Residual Diagnostics | |
| Description | Link |
| Histogram | Compute |
| Central Tendency | Compute |
| QQ Plot | Compute |
| Kernel Density Plot | Compute |
| Skewness/Kurtosis Test | Compute |
| Skewness-Kurtosis Plot | Compute |
| Harrell-Davis Plot | Compute |
| Bootstrap Plot -- Central Tendency | Compute |
| Blocked Bootstrap Plot -- Central Tendency | Compute |
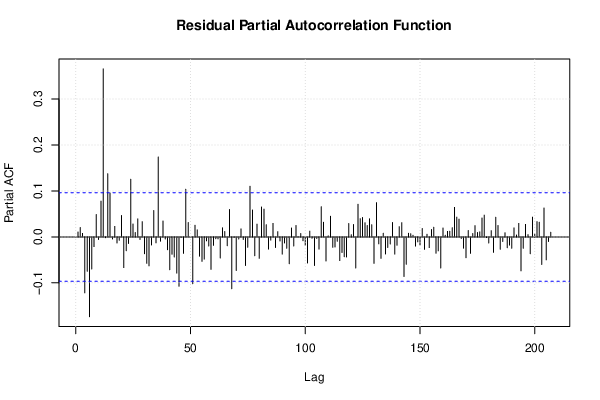
| (Partial) Autocorrelation Plot | Compute |
| Spectral Analysis | Compute |
| Tukey lambda PPCC Plot | Compute |
| Box-Cox Normality Plot | Compute |
| Summary Statistics | Compute |
| Ramsey RESET F-Test for powers (2 and 3) of fitted values |
> reset_test_fitted RESET test data: mylm RESET = 0.9983, df1 = 2, df2 = 403, p-value = 0.3694 |
| Ramsey RESET F-Test for powers (2 and 3) of regressors |
> reset_test_regressors RESET test data: mylm RESET = 1.703, df1 = 16, df2 = 389, p-value = 0.0437 |
| Ramsey RESET F-Test for powers (2 and 3) of principal components |
> reset_test_principal_components RESET test data: mylm RESET = 0.92595, df1 = 2, df2 = 403, p-value = 0.397 |
| Variance Inflation Factors (Multicollinearity) |
> vif
              unit_price              US_IND_PROD              defl_price1
                9.833502                14.979192                97.766003
             defl_price2              defl_price3 `barrels_purchased(t-1)`
              235.583127                81.247345                13.100493
`barrels_purchased(t-2)` `barrels_purchased(t-3)`
               13.737677                13.174221
|