| Multiple Linear Regression - Estimated Regression Equation |
| LFM[t] = + 30015.2 + 16.8152Calculation[t] + 17.7631Algebraic_Reasoning[t] -8.77305Graphical_Interpretation[t] + 0.40022Proportionality_and_Ratio[t] -0.548369Probability_and_Sampling[t] -4.85314Estimation[t] -14.8775year[t] + 42.184group[t] -7.42246gender[t] + e[t] |
| Multiple Linear Regression - Ordinary Least Squares | |||||
| Variable | Parameter | S.D. | T-STAT H0: parameter = 0 | 2-tail p-value | 1-tail p-value |
| (Intercept) | +3.002e+04 | 8383 | +3.5810e+00 | 0.0004069 | 0.0002035 |
| Calculation | +16.82 | 13.73 | +1.2250e+00 | 0.2216 | 0.1108 |
| Algebraic_Reasoning | +17.76 | 12.86 | +1.3810e+00 | 0.1684 | 0.08418 |
| Graphical_Interpretation | -8.773 | 10.08 | -8.7050e-01 | 0.3848 | 0.1924 |
| Proportionality_and_Ratio | +0.4002 | 6.316 | +6.3370e-02 | 0.9495 | 0.4748 |
| Probability_and_Sampling | -0.5484 | 6.032 | -9.0910e-02 | 0.9276 | 0.4638 |
| Estimation | -4.853 | 5.583 | -8.6930e-01 | 0.3854 | 0.1927 |
| year | -14.88 | 4.167 | -3.5700e+00 | 0.0004227 | 0.0002114 |
| group | +42.18 | 4.156 | +1.0150e+01 | 1.074e-20 | 5.372e-21 |
| gender | -7.423 | 4.321 | -1.7180e+00 | 0.08698 | 0.04349 |
| Multiple Linear Regression - Regression Statistics | |
| Multiple R | 0.5689 |
| R-squared | 0.3237 |
| Adjusted R-squared | 0.301 |
| F-TEST (value) | 14.25 |
| F-TEST (DF numerator) | 9 |
| F-TEST (DF denominator) | 268 |
| p-value | 0 |
| Multiple Linear Regression - Residual Statistics | |
| Residual Standard Deviation | 33.3 |
| Sum Squared Residuals | 2.973e+05 |
| Menu of Residual Diagnostics | |
| Description | Link |
| Histogram | Compute |
| Central Tendency | Compute |
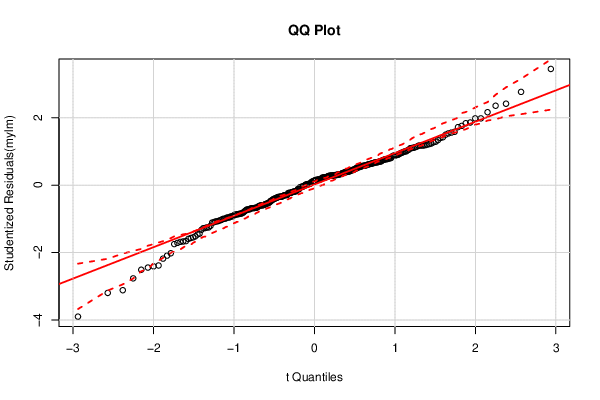
| QQ Plot | Compute |
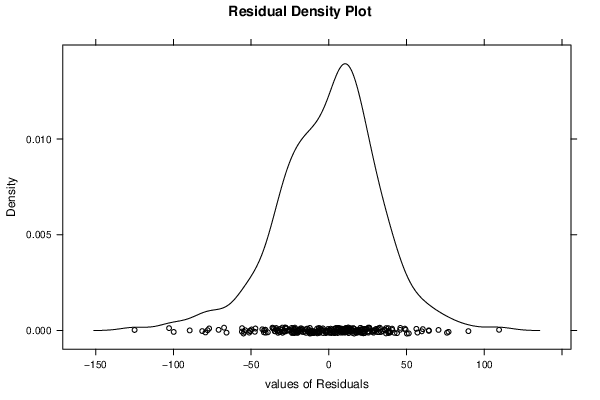
| Kernel Density Plot | Compute |
| Skewness/Kurtosis Test | Compute |
| Skewness-Kurtosis Plot | Compute |
| Harrell-Davis Plot | Compute |
| Bootstrap Plot -- Central Tendency | Compute |
| Blocked Bootstrap Plot -- Central Tendency | Compute |
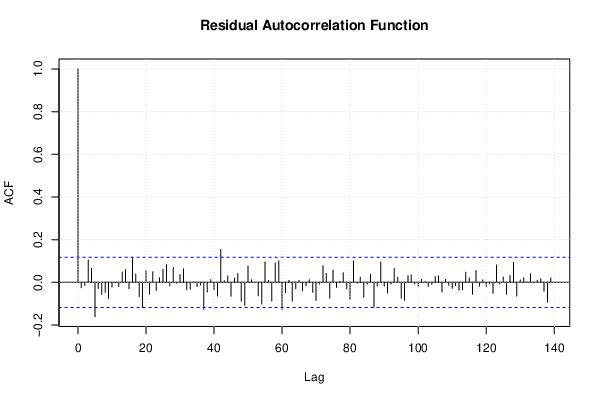
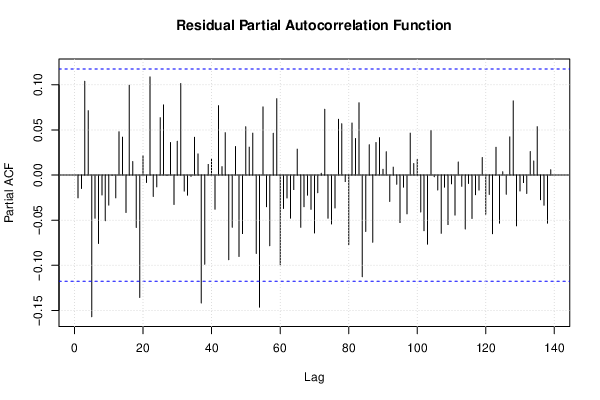
| (Partial) Autocorrelation Plot | Compute |
| Spectral Analysis | Compute |
| Tukey lambda PPCC Plot | Compute |
| Box-Cox Normality Plot | Compute |
| Summary Statistics | Compute |
| Ramsey RESET F-Test for powers (2 and 3) of fitted values |
> reset_test_fitted RESET test data: mylm RESET = 0.8271, df1 = 2, df2 = 266, p-value = 0.4384 |
| Ramsey RESET F-Test for powers (2 and 3) of regressors |
> reset_test_regressors RESET test data: mylm RESET = 0.99573, df1 = 18, df2 = 250, p-value = 0.4651 |
| Ramsey RESET F-Test for powers (2 and 3) of principal components |
> reset_test_principal_components RESET test data: mylm RESET = 0.41606, df1 = 2, df2 = 266, p-value = 0.6601 |
| Variance Inflation Factors (Multicollinearity) |
> vif
              Calculation       Algebraic_Reasoning  Graphical_Interpretation
                 1.528723                  1.537420                  1.474383
Proportionality_and_Ratio  Probability_and_Sampling                Estimation
                 1.242964                  1.241507                  1.176971
                     year                     group                    gender
                 1.047056                  1.081735                  1.147914
|