| Multiple Linear Regression - Estimated Regression Equation |
| LFM[t] = + 457.835 -0.257664Calculation[t] + 0.000592109Graphical_Interpretation[t] -0.0312515Proportionality_and_Ratio[t] + 0.000842536Probability_and_Sampling[t] -0.0314156Algebraic_Reasoning[t] -0.00606398Estimation[t] + 0.0312612year[t] + 0.0253258group[t] -0.226525gender[t] -0.0150551`LFM(t-1s)`[t] -0.0297634`LFM(t-2s)`[t] -0.0229772`LFM(t-3s)`[t] -389.618M1[t] -392.005M2[t] + 62.6812M3[t] + 0.105332M4[t] -386.178M5[t] -391.941M6[t] + 62.9414M7[t] + 0.110614M8[t] -395.217M9[t] -391.977M10[t] + 62.7755M11[t] -0.00840817t + e[t] |
| Multiple Linear Regression - Ordinary Least Squares | |||||
| Variable | Parameter | S.D. | T-STAT H0: parameter = 0 | 2-tail p-value | 1-tail p-value |
| (Intercept) | +457.8 | 2704 | +1.6930e-01 | 0.8656 | 0.4328 |
| Calculation | -0.2577 | 1.344 | -1.9180e-01 | 0.848 | 0.424 |
| Graphical_Interpretation | +0.0005921 | 0.04426 | +1.3380e-02 | 0.9893 | 0.4947 |
| Proportionality_and_Ratio | -0.03125 | 0.004262 | -7.3320e+00 | 1.541e-12 | 7.707e-13 |
| Probability_and_Sampling | +0.0008425 | 0.05007 | +1.6830e-02 | 0.9866 | 0.4933 |
| Algebraic_Reasoning | -0.03142 | 0.004232 | -7.4240e+00 | 8.452e-13 | 4.226e-13 |
| Estimation | -0.006064 | 0.05357 | -1.1320e-01 | 0.9099 | 0.455 |
| year | +0.03126 | 0.004197 | +7.4480e+00 | 7.232e-13 | 3.616e-13 |
| group | +0.02533 | 0.05031 | +5.0340e-01 | 0.615 | 0.3075 |
| gender | -0.2265 | 1.343 | -1.6860e-01 | 0.8662 | 0.4331 |
| `LFM(t-1s)` | -0.01506 | 0.05421 | -2.7770e-01 | 0.7814 | 0.3907 |
| `LFM(t-2s)` | -0.02976 | 0.05329 | -5.5860e-01 | 0.5768 | 0.2884 |
| `LFM(t-3s)` | -0.02298 | 0.0518 | -4.4360e-01 | 0.6576 | 0.3288 |
| M1 | -389.6 | 2702 | -1.4420e-01 | 0.8854 | 0.4427 |
| M2 | -392 | 2701 | -1.4510e-01 | 0.8847 | 0.4424 |
| M3 | +62.68 | 8.929 | +7.0200e+00 | 1.131e-11 | 5.653e-12 |
| M4 | +0.1053 | 3.442 | +3.0600e-02 | 0.9756 | 0.4878 |
| M5 | -386.2 | 2701 | -1.4300e-01 | 0.8864 | 0.4432 |
| M6 | -391.9 | 2701 | -1.4510e-01 | 0.8847 | 0.4424 |
| M7 | +62.94 | 8.9 | +7.0720e+00 | 8.152e-12 | 4.076e-12 |
| M8 | +0.1106 | 3.438 | +3.2180e-02 | 0.9743 | 0.4872 |
| M9 | -395.2 | 2702 | -1.4630e-01 | 0.8838 | 0.4419 |
| M10 | -392 | 2701 | -1.4510e-01 | 0.8847 | 0.4424 |
| M11 | +62.77 | 8.956 | +7.0090e+00 | 1.209e-11 | 6.045e-12 |
| t | -0.008408 | 0.006412 | -1.3110e+00 | 0.1906 | 0.0953 |
| Multiple Linear Regression - Regression Statistics | |
| Multiple R | 0.9525 |
| R-squared | 0.9073 |
| Adjusted R-squared | 0.901 |
| F-TEST (value) | 145.1 |
| F-TEST (DF numerator) | 24 |
| F-TEST (DF denominator) | 356 |
| p-value | 0 |
| Multiple Linear Regression - Residual Statistics | |
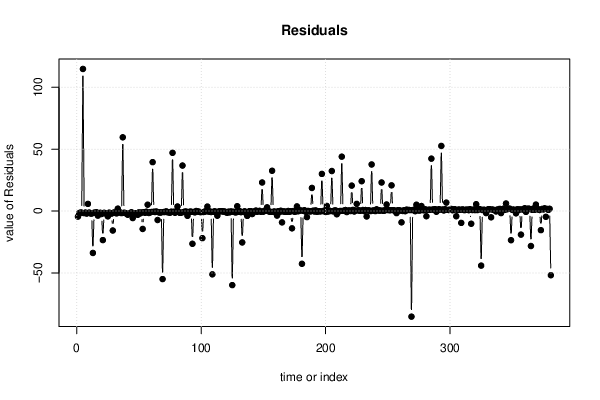
| Residual Standard Deviation | 13.63 |
| Sum Squared Residuals | 6.611e+04 |
| Menu of Residual Diagnostics | |
| Description | Link |
| Histogram | Compute |
| Central Tendency | Compute |
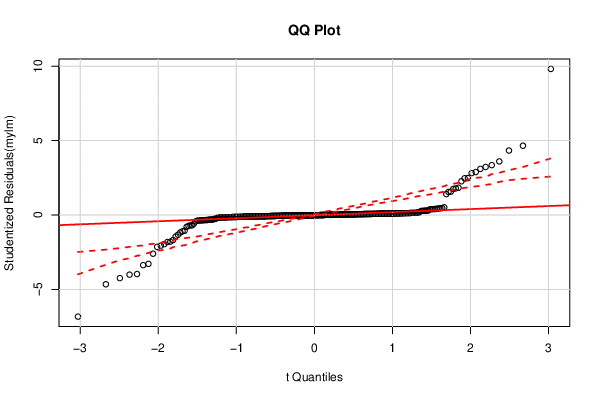
| QQ Plot | Compute |
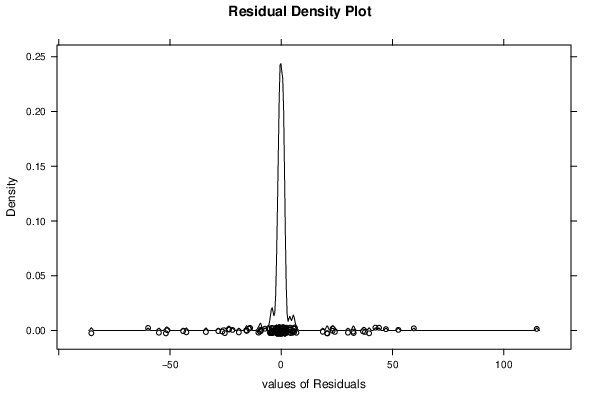
| Kernel Density Plot | Compute |
| Skewness/Kurtosis Test | Compute |
| Skewness-Kurtosis Plot | Compute |
| Harrell-Davis Plot | Compute |
| Bootstrap Plot -- Central Tendency | Compute |
| Blocked Bootstrap Plot -- Central Tendency | Compute |
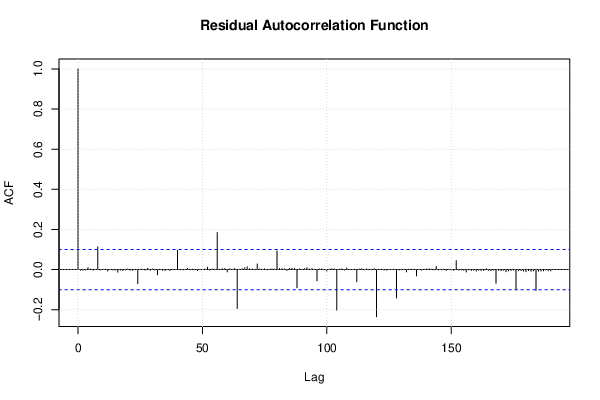
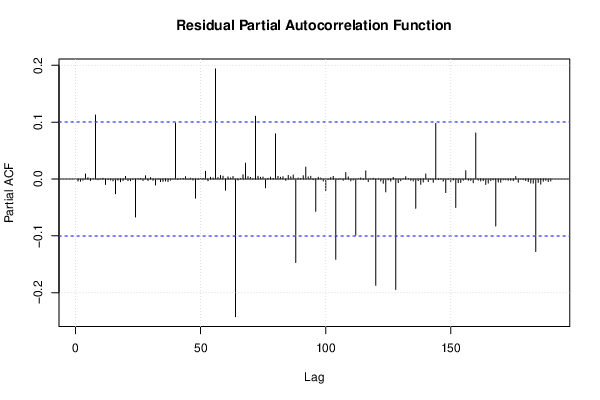
| (Partial) Autocorrelation Plot | Compute |
| Spectral Analysis | Compute |
| Tukey lambda PPCC Plot | Compute |
| Box-Cox Normality Plot | Compute |
| Summary Statistics | Compute |
| Ramsey RESET F-Test for powers (2 and 3) of fitted values |
> reset_test_fitted RESET test data: mylm RESET = 10.823, df1 = 2, df2 = 354, p-value = 2.741e-05 |
| Ramsey RESET F-Test for powers (2 and 3) of regressors |
> reset_test_regressors RESET test data: mylm RESET = 0.99133, df1 = 48, df2 = 308, p-value = 0.4944 |
| Ramsey RESET F-Test for powers (2 and 3) of principal components |
> reset_test_principal_components RESET test data: mylm RESET = 1.0642, df1 = 2, df2 = 354, p-value = 0.3461 |
| Variance Inflation Factors (Multicollinearity) |
> vif
              Calculation  Graphical_Interpretation Proportionality_and_Ratio
             2.823219e+06              7.269652e+00              2.801808e+01
 Probability_and_Sampling       Algebraic_Reasoning                Estimation
             9.859236e+00              2.800328e+01              1.014120e+01
                     year                     group                    gender
             2.755229e+01              9.503660e+00              2.782353e+06
              `LFM(t-1s)`               `LFM(t-2s)`               `LFM(t-3s)`
             1.149021e+01              1.133341e+01              1.137675e+01
                       M1                        M2                        M3
             1.151955e+06              1.151804e+06              1.258476e+01
                       M4                        M5                        M6
             1.869784e+00              1.151773e+06              1.151630e+06
                       M7                        M8                        M9
             1.250389e+01              1.865369e+00              1.151975e+06
                      M10                       M11                         t
             1.118877e+06              1.230063e+01              1.020350e+00
|