| Multiple Linear Regression - Estimated Regression Equation |
| barrels_purchased[t] = + 9013.83 -171.548unit_price[t] -278.737cpi[t] -8819.06dum[t] + 855.489US_IND_PROD[t] + 0.282029`barrels_purchased(t-1)`[t] + 0.300877`barrels_purchased(t-2)`[t] + 0.145139`barrels_purchased(t-3)`[t] + 0.153519`barrels_purchased(t-1s)`[t] + 0.00346685`barrels_purchased(t-2s)`[t] + 0.0162583`barrels_purchased(t-3s)`[t] + 4287.71M1[t] + 6850.14M2[t] + 5187.78M3[t] + 2046.86M4[t] + 2029.05M5[t] -10480.3M6[t] -4440.89M7[t] -10246.8M8[t] -8983.07M9[t] -1355.11M10[t] -20937.6M11[t] + e[t] |
| Multiple Linear Regression - Ordinary Least Squares | |||||
| Variable | Parameter | S.D. | T-STAT H0: parameter = 0 | 2-tail p-value | 1-tail p-value |
| (Intercept) | +9014 | 7851 | +1.1480e+00 | 0.2517 | 0.1258 |
| unit_price | -171.6 | 100.4 | -1.7080e+00 | 0.08848 | 0.04424 |
| cpi | -278.7 | 118.5 | -2.3520e+00 | 0.01919 | 0.009594 |
| dum | -8819 | 4856 | -1.8160e+00 | 0.07017 | 0.03508 |
| US_IND_PROD | +855.5 | 275.4 | +3.1060e+00 | 0.002046 | 0.001023 |
| `barrels_purchased(t-1)` | +0.282 | 0.05199 | +5.4240e+00 | 1.072e-07 | 5.36e-08 |
| `barrels_purchased(t-2)` | +0.3009 | 0.05165 | +5.8260e+00 | 1.266e-08 | 6.329e-09 |
| `barrels_purchased(t-3)` | +0.1451 | 0.05155 | +2.8160e+00 | 0.005134 | 0.002567 |
| `barrels_purchased(t-1s)` | +0.1535 | 0.04555 | +3.3700e+00 | 0.0008323 | 0.0004161 |
| `barrels_purchased(t-2s)` | +0.003467 | 0.04378 | +7.9200e-02 | 0.9369 | 0.4685 |
| `barrels_purchased(t-3s)` | +0.01626 | 0.03949 | +4.1170e-01 | 0.6808 | 0.3404 |
| M1 | +4288 | 4467 | +9.5990e-01 | 0.3378 | 0.1689 |
| M2 | +6850 | 4462 | +1.5350e+00 | 0.1256 | 0.0628 |
| M3 | +5188 | 4344 | +1.1940e+00 | 0.2332 | 0.1166 |
| M4 | +2047 | 4353 | +4.7020e-01 | 0.6385 | 0.3192 |
| M5 | +2029 | 4306 | +4.7120e-01 | 0.6378 | 0.3189 |
| M6 | -1.048e+04 | 4336 | -2.4170e+00 | 0.01614 | 0.008069 |
| M7 | -4441 | 4150 | -1.0700e+00 | 0.2853 | 0.1426 |
| M8 | -1.025e+04 | 4303 | -2.3810e+00 | 0.01778 | 0.008889 |
| M9 | -8983 | 4139 | -2.1700e+00 | 0.03063 | 0.01531 |
| M10 | -1355 | 4209 | -3.2200e-01 | 0.7477 | 0.3738 |
| M11 | -2.094e+04 | 4397 | -4.7620e+00 | 2.783e-06 | 1.392e-06 |
| Multiple Linear Regression - Regression Statistics | |
| Multiple R | 0.9743 |
| R-squared | 0.9492 |
| Adjusted R-squared | 0.9462 |
| F-TEST (value) | 319.2 |
| F-TEST (DF numerator) | 21 |
| F-TEST (DF denominator) | 359 |
| p-value | 0 |
| Multiple Linear Regression - Residual Statistics | |
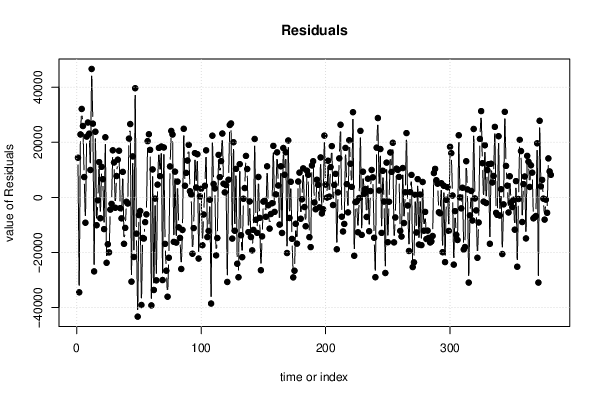
| Residual Standard Deviation | 1.606e+04 |
| Sum Squared Residuals | 9.26e+10 |
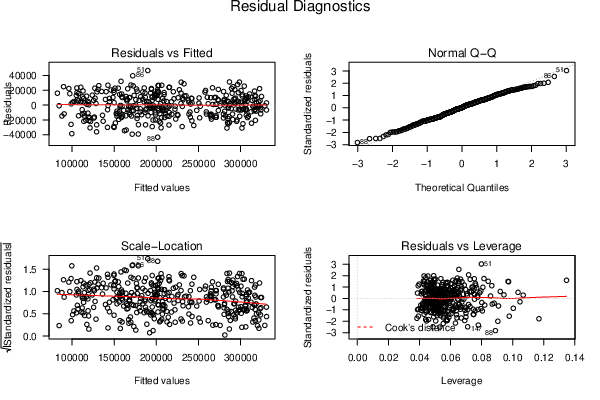
| Menu of Residual Diagnostics | |
| Description | Link |
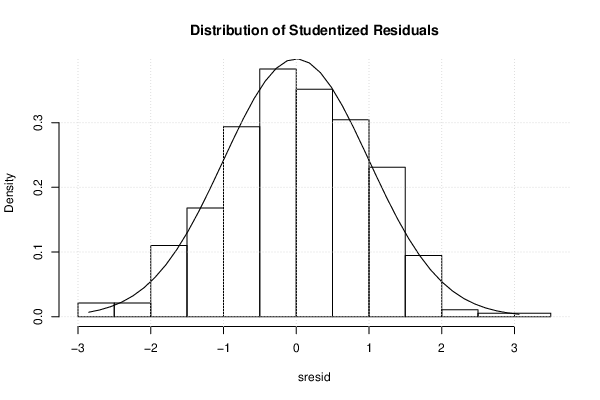
| Histogram | Compute |
| Central Tendency | Compute |
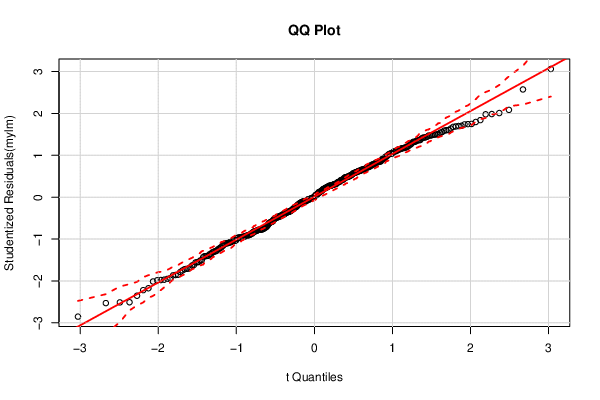
| QQ Plot | Compute |
| Kernel Density Plot | Compute |
| Skewness/Kurtosis Test | Compute |
| Skewness-Kurtosis Plot | Compute |
| Harrell-Davis Plot | Compute |
| Bootstrap Plot -- Central Tendency | Compute |
| Blocked Bootstrap Plot -- Central Tendency | Compute |
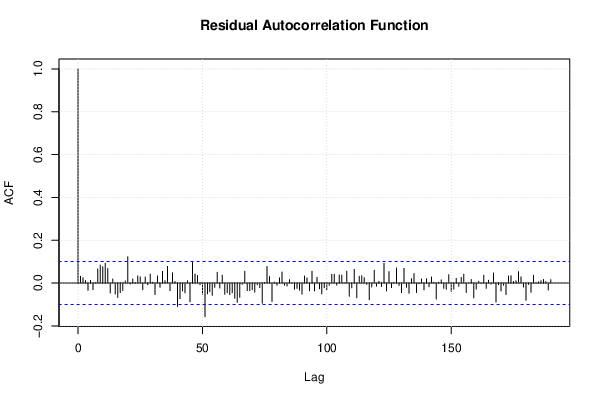
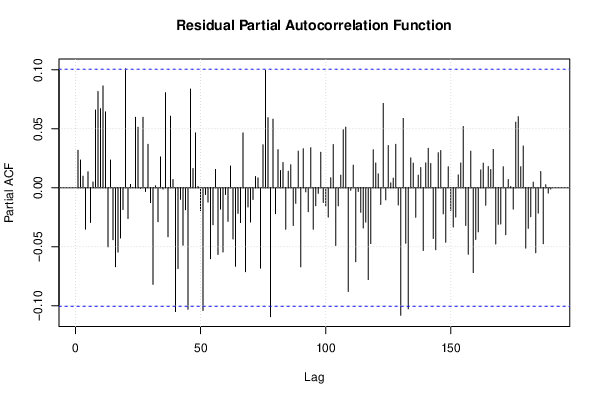
| (Partial) Autocorrelation Plot | Compute |
| Spectral Analysis | Compute |
| Tukey lambda PPCC Plot | Compute |
| Box-Cox Normality Plot | Compute |
| Summary Statistics | Compute |
| Ramsey RESET F-Test for powers (2 and 3) of fitted values |
> reset_test_fitted RESET test data: mylm RESET = 0.040154, df1 = 2, df2 = 357, p-value = 0.9606 |
| Ramsey RESET F-Test for powers (2 and 3) of regressors |
> reset_test_regressors RESET test data: mylm RESET = 1.3211, df1 = 42, df2 = 317, p-value = 0.09701 |
| Ramsey RESET F-Test for powers (2 and 3) of principal components |
> reset_test_principal_components RESET test data: mylm RESET = 0.96177, df1 = 2, df2 = 357, p-value = 0.3832 |
| Variance Inflation Factors (Multicollinearity) |
> vif
               unit_price                       cpi                       dum
                 2.520552                 37.140434                  7.547450
              US_IND_PROD  `barrels_purchased(t-1)`  `barrels_purchased(t-2)`
                37.973631                 19.049990                 18.789198
 `barrels_purchased(t-3)` `barrels_purchased(t-1s)` `barrels_purchased(t-2s)`
                18.625688                 14.289173                 12.736382
`barrels_purchased(t-3s)`                        M1                        M2
                 9.990720                  2.267429                  2.262196
                       M3                        M4                        M5
                 2.144312                  2.152989                  2.107448
                       M6                        M7                        M8
                 2.136160                  1.956801                  2.104311
                       M9                       M10                       M11
                 1.946481                  1.955763                  2.134070
|