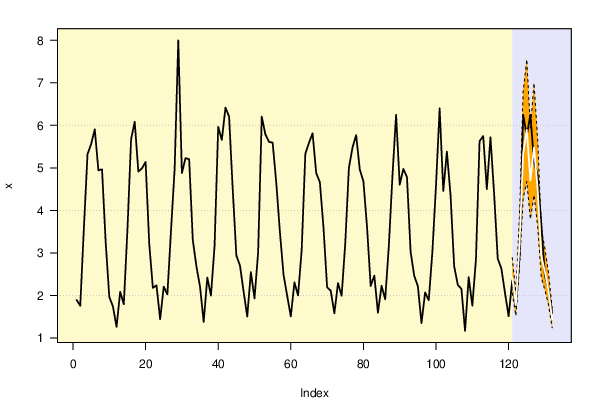
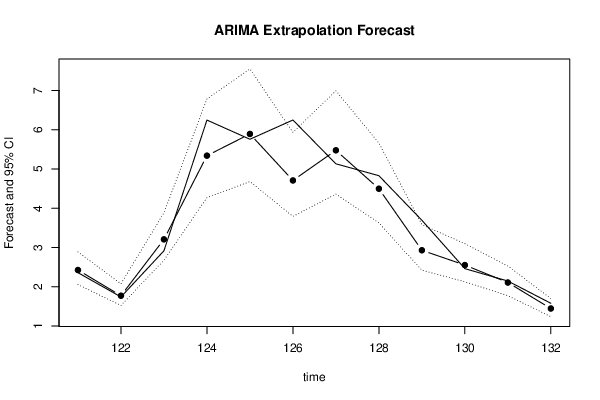
| Univariate ARIMA Extrapolation Forecast | ||||||||
| time | Y[t] | F[t] | 95% LB | 95% UB | p-value (H0: Y[t] = F[t]) | P(F[t]>Y[t-1]) | P(F[t]>Y[t-s]) | P(F[t]>Y[120]) |
| 108 | 1.169 | - | - | - | - | - | - | - |
| 109 | 2.429 | - | - | - | - | - | - | - |
| 110 | 1.762 | - | - | - | - | - | - | - |
| 111 | 2.846 | - | - | - | - | - | - | - |
| 112 | 5.627 | - | - | - | - | - | - | - |
| 113 | 5.749 | - | - | - | - | - | - | - |
| 114 | 4.502 | - | - | - | - | - | - | - |
| 115 | 5.72 | - | - | - | - | - | - | - |
| 116 | 4.403 | - | - | - | - | - | - | - |
| 117 | 2.867 | - | - | - | - | - | - | - |
| 118 | 2.635 | - | - | - | - | - | - | - |
| 119 | 2.059 | - | - | - | - | - | - | - |
| 120 | 1.511 | - | - | - | - | - | - | - |
| 121 | 2.359 | 2.4264 | 2.0566 | 2.8876 | 0.3872 | 0.9999 | 0.4957 | 0.9999 |
| 122 | 1.741 | 1.7716 | 1.5224 | 2.0766 | 0.422 | 1e-04 | 0.5246 | 0.953 |
| 123 | 2.917 | 3.2082 | 2.6771 | 3.8849 | 0.1995 | 1 | 0.853 | 1 |
| 124 | 6.249 | 5.3416 | 4.2718 | 6.7876 | 0.1094 | 0.9995 | 0.3494 | 1 |
| 125 | 5.76 | 5.8955 | 4.6818 | 7.5521 | 0.4363 | 0.3379 | 0.5688 | 1 |
| 126 | 6.25 | 4.7098 | 3.7935 | 5.936 | 0.0069 | 0.0466 | 0.6301 | 1 |
| 127 | 5.134 | 5.4782 | 4.3625 | 6.9951 | 0.3283 | 0.1593 | 0.3773 | 1 |
| 128 | 4.831 | 4.4992 | 3.628 | 5.6631 | 0.2882 | 0.1425 | 0.5644 | 1 |
| 129 | 3.695 | 2.9301 | 2.4229 | 3.5845 | 0.011 | 0 | 0.5749 | 1 |
| 130 | 2.462 | 2.5529 | 2.1265 | 3.0974 | 0.3718 | 0 | 0.3837 | 0.9999 |
| 131 | 2.146 | 2.1079 | 1.7734 | 2.5294 | 0.4297 | 0.0498 | 0.59 | 0.9972 |
| 132 | 1.579 | 1.4453 | 1.2381 | 1.7 | 0.1517 | 0 | 0.3065 | 0.3065 |
| Univariate ARIMA Extrapolation Forecast Performance | |||||||||
| time | % S.E. | PE | MAPE | sMAPE | Sq.E | MSE | RMSE | ScaledE | MASE |
| 121 | 0.097 | -0.0286 | 0.0286 | 0.0282 | 0.0045 | 0 | 0 | -0.0688 | 0.0688 |
| 122 | 0.0878 | -0.0176 | 0.0231 | 0.0228 | 9e-04 | 0.0027 | 0.0524 | -0.0313 | 0.05 |
| 123 | 0.1076 | -0.0998 | 0.0487 | 0.0469 | 0.0848 | 0.0301 | 0.1735 | -0.2973 | 0.1325 |
| 124 | 0.1381 | 0.1452 | 0.0728 | 0.0743 | 0.8233 | 0.2284 | 0.4779 | 0.9262 | 0.3309 |
| 125 | 0.1434 | -0.0235 | 0.0629 | 0.0641 | 0.0184 | 0.1864 | 0.4317 | -0.1383 | 0.2924 |
| 126 | 0.1328 | 0.2464 | 0.0935 | 0.1003 | 2.3722 | 0.5507 | 0.7421 | 1.5722 | 0.5057 |
| 127 | 0.1413 | -0.067 | 0.0897 | 0.0952 | 0.1185 | 0.4889 | 0.6992 | -0.3513 | 0.4836 |
| 128 | 0.132 | 0.0687 | 0.0871 | 0.0922 | 0.1101 | 0.4416 | 0.6645 | 0.3387 | 0.4655 |
| 129 | 0.1139 | 0.207 | 0.1004 | 0.1076 | 0.5851 | 0.4575 | 0.6764 | 0.7808 | 0.5005 |
| 130 | 0.1088 | -0.0369 | 0.0941 | 0.1005 | 0.0083 | 0.4126 | 0.6423 | -0.0927 | 0.4598 |
| 131 | 0.102 | 0.0177 | 0.0871 | 0.093 | 0.0014 | 0.3752 | 0.6126 | 0.0389 | 0.4215 |
| 132 | 0.0899 | 0.0847 | 0.0869 | 0.0926 | 0.0179 | 0.3455 | 0.5877 | 0.1365 | 0.3978 |

