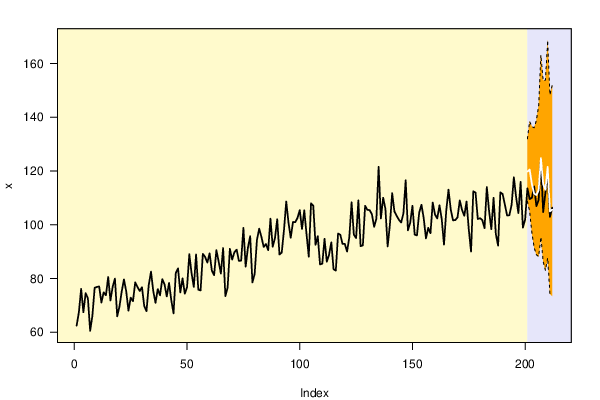
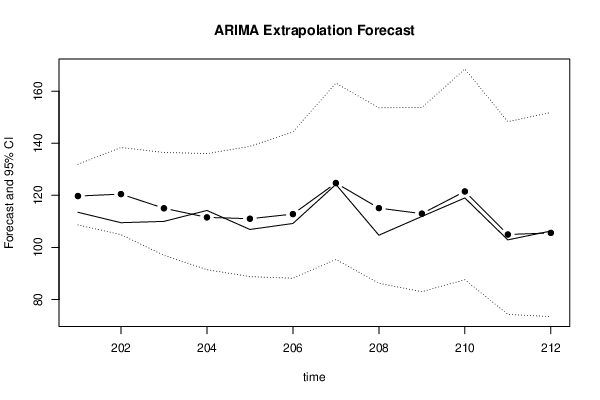
| Univariate ARIMA Extrapolation Forecast | ||||||||
| time | Y[t] | F[t] | 95% LB | 95% UB | p-value (H0: Y[t] = F[t]) | P(F[t]>Y[t-1]) | P(F[t]>Y[t-s]) | P(F[t]>Y[200]) |
| 188 | 92.2 | - | - | - | - | - | - | - |
| 189 | 112 | - | - | - | - | - | - | - |
| 190 | 111.4 | - | - | - | - | - | - | - |
| 191 | 107.5 | - | - | - | - | - | - | - |
| 192 | 103.4 | - | - | - | - | - | - | - |
| 193 | 103.5 | - | - | - | - | - | - | - |
| 194 | 107.4 | - | - | - | - | - | - | - |
| 195 | 117.6 | - | - | - | - | - | - | - |
| 196 | 110.2 | - | - | - | - | - | - | - |
| 197 | 104.3 | - | - | - | - | - | - | - |
| 198 | 115.9 | - | - | - | - | - | - | - |
| 199 | 98.9 | - | - | - | - | - | - | - |
| 200 | 101.9 | - | - | - | - | - | - | - |
| 201 | 113.5 | 119.7314 | 108.6348 | 131.9615 | 0.159 | 0.9979 | 0.8923 | 0.9979 |
| 202 | 109.5 | 120.4862 | 104.9024 | 138.3852 | 0.1145 | 0.7779 | 0.8401 | 0.9791 |
| 203 | 110 | 115.0465 | 96.9829 | 136.4746 | 0.3222 | 0.694 | 0.755 | 0.8854 |
| 204 | 114.2 | 111.5494 | 91.4601 | 136.0512 | 0.416 | 0.5493 | 0.7428 | 0.7799 |
| 205 | 106.9 | 111.0226 | 88.7875 | 138.8262 | 0.3857 | 0.4114 | 0.702 | 0.7399 |
| 206 | 109.2 | 112.8085 | 88.158 | 144.3516 | 0.4113 | 0.6432 | 0.6316 | 0.7511 |
| 207 | 124.2 | 124.7311 | 95.3885 | 163.0998 | 0.4892 | 0.7862 | 0.6422 | 0.8783 |
| 208 | 104.7 | 115.097 | 86.2318 | 153.6244 | 0.2984 | 0.3216 | 0.5984 | 0.749 |
| 209 | 111.9 | 112.9724 | 82.9934 | 153.7804 | 0.4795 | 0.6544 | 0.6615 | 0.7026 |
| 210 | 119 | 121.506 | 87.5895 | 168.5555 | 0.4584 | 0.6555 | 0.5923 | 0.793 |
| 211 | 102.9 | 104.9599 | 74.2891 | 148.2933 | 0.4629 | 0.2627 | 0.608 | 0.555 |
| 212 | 106.3 | 105.5808 | 73.4105 | 151.849 | 0.4878 | 0.5452 | 0.562 | 0.562 |
| Univariate ARIMA Extrapolation Forecast Performance | |||||||||
| time | % S.E. | PE | MAPE | sMAPE | Sq.E | MSE | RMSE | ScaledE | MASE |
| 201 | 0.0521 | -0.0549 | 0.0549 | 0.0534 | 38.8307 | 0 | 0 | -0.7915 | 0.7915 |
| 202 | 0.0758 | -0.1003 | 0.0776 | 0.0745 | 120.6972 | 79.764 | 8.9311 | -1.3955 | 1.0935 |
| 203 | 0.095 | -0.0459 | 0.067 | 0.0646 | 25.4676 | 61.6652 | 7.8527 | -0.641 | 0.9427 |
| 204 | 0.1121 | 0.0232 | 0.0561 | 0.0543 | 7.0258 | 48.0053 | 6.9286 | 0.3367 | 0.7912 |
| 205 | 0.1278 | -0.0386 | 0.0526 | 0.051 | 16.9962 | 41.8035 | 6.4656 | -0.5237 | 0.7377 |
| 206 | 0.1427 | -0.033 | 0.0493 | 0.0479 | 13.021 | 37.0064 | 6.0833 | -0.4584 | 0.6911 |
| 207 | 0.1569 | -0.0043 | 0.0429 | 0.0417 | 0.2821 | 31.7601 | 5.6356 | -0.0675 | 0.602 |
| 208 | 0.1708 | -0.0993 | 0.0499 | 0.0483 | 108.0969 | 41.3022 | 6.4267 | -1.3206 | 0.6919 |
| 209 | 0.1843 | -0.0096 | 0.0455 | 0.044 | 1.15 | 36.8408 | 6.0697 | -0.1362 | 0.6301 |
| 210 | 0.1976 | -0.0211 | 0.043 | 0.0417 | 6.2799 | 33.7847 | 5.8125 | -0.3183 | 0.5989 |
| 211 | 0.2106 | -0.02 | 0.0409 | 0.0397 | 4.2431 | 31.0991 | 5.5767 | -0.2616 | 0.5683 |
| 212 | 0.2236 | 0.0068 | 0.0381 | 0.037 | 0.5172 | 28.5506 | 5.3433 | 0.0914 | 0.5285 |

