| Multiple Linear Regression - Estimated Regression Equation |
| Score[t] = -3.2811 -0.715633Geslacht[t] -2.84284X1[t] + 0.179305X2[t] -0.4232X3[t] + 1.03283X4[t] + 3.50773X5[t] + e[t] |
| Multiple Linear Regression - Ordinary Least Squares | |||||
| Variable | Parameter | S.D. | T-STAT H0: parameter = 0 | 2-tail p-value | 1-tail p-value |
| (Intercept) | -3.281 | 11.4 | -2.8780e-01 | 0.7781 | 0.389 |
| Geslacht | -0.7156 | 2.534 | -2.8240e-01 | 0.7821 | 0.391 |
| X1 | -2.843 | 3.264 | -8.7100e-01 | 0.3996 | 0.1998 |
| X2 | +0.1793 | 2.824 | +6.3500e-02 | 0.9503 | 0.4752 |
| X3 | -0.4232 | 2.908 | -1.4560e-01 | 0.8865 | 0.4433 |
| X4 | +1.033 | 2.994 | +3.4500e-01 | 0.7356 | 0.3678 |
| X5 | +3.508 | 3.397 | +1.0320e+00 | 0.3207 | 0.1603 |
| Multiple Linear Regression - Regression Statistics | |
| Multiple R | 0.4453 |
| R-squared | 0.1983 |
| Adjusted R-squared | -0.1717 |
| F-TEST (value) | 0.536 |
| F-TEST (DF numerator) | 6 |
| F-TEST (DF denominator) | 13 |
| p-value | 0.7719 |
| Multiple Linear Regression - Residual Statistics | |
| Residual Standard Deviation | 5.432 |
| Sum Squared Residuals | 383.6 |
| Menu of Residual Diagnostics | |
| Description | Link |
| Histogram | Compute |
| Central Tendency | Compute |
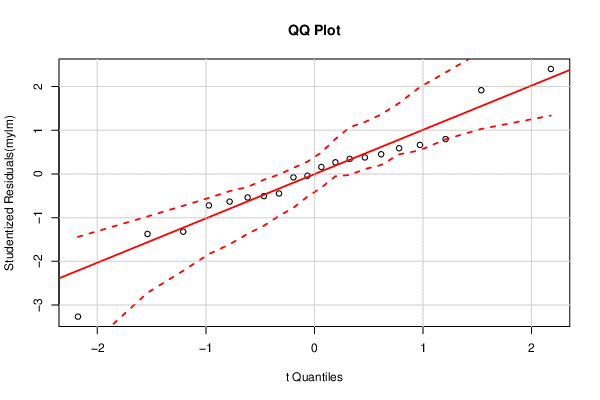
| QQ Plot | Compute |
| Kernel Density Plot | Compute |
| Skewness/Kurtosis Test | Compute |
| Skewness-Kurtosis Plot | Compute |
| Harrell-Davis Plot | Compute |
| Bootstrap Plot -- Central Tendency | Compute |
| Blocked Bootstrap Plot -- Central Tendency | Compute |
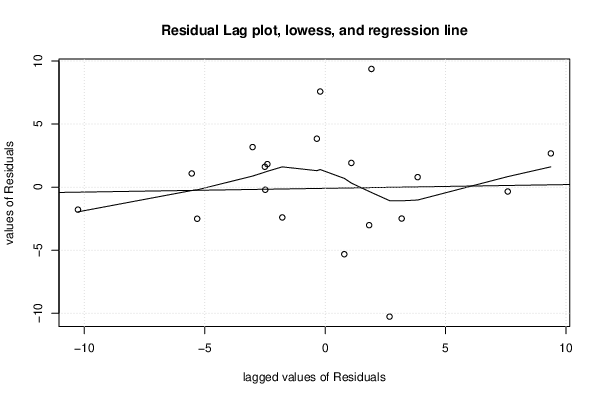
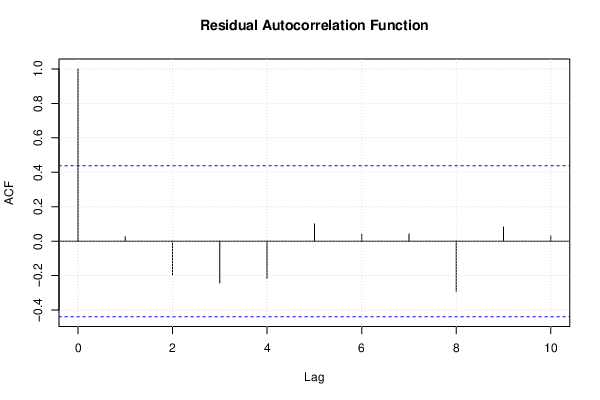
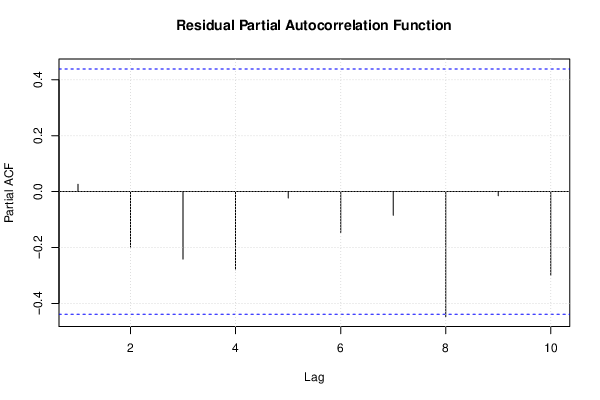
| (Partial) Autocorrelation Plot | Compute |
| Spectral Analysis | Compute |
| Tukey lambda PPCC Plot | Compute |
| Box-Cox Normality Plot | Compute |
| Summary Statistics | Compute |
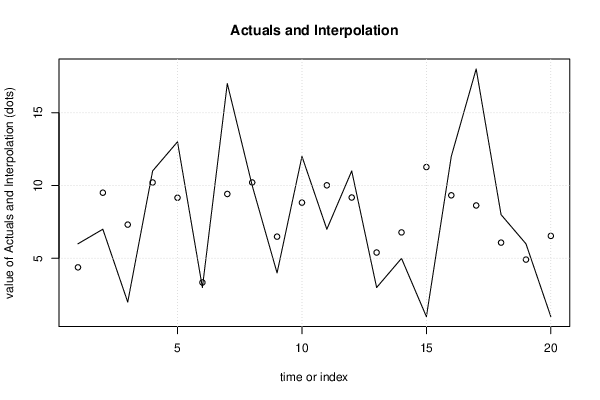
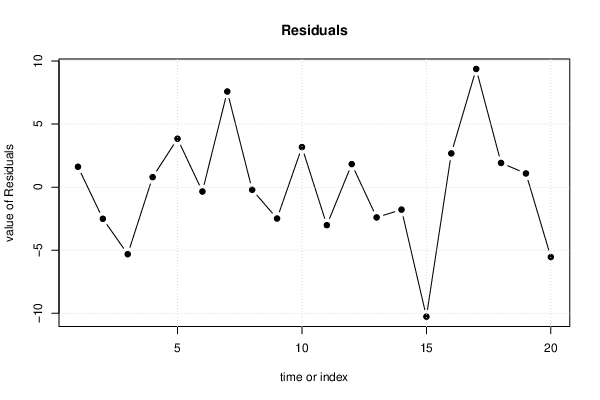
| Multiple Linear Regression - Actuals, Interpolation, and Residuals | |||
| Time or Index | Actuals | Interpolation Forecast | Residuals Prediction Error |
| 1 | 6 | 4.385 | 1.615 |
| 2 | 7 | 9.507 | -2.507 |
| 3 | 2 | 7.315 | -5.315 |
| 4 | 11 | 10.21 | 0.7919 |
| 5 | 13 | 9.161 | 3.839 |
| 6 | 3 | 3.347 | -0.3469 |
| 7 | 17 | 9.42 | 7.58 |
| 8 | 10 | 10.21 | -0.2081 |
| 9 | 4 | 6.49 | -2.49 |
| 10 | 12 | 8.824 | 3.176 |
| 11 | 7 | 10.01 | -3.015 |
| 12 | 11 | 9.175 | 1.825 |
| 13 | 3 | 5.402 | -2.402 |
| 14 | 5 | 6.782 | -1.782 |
| 15 | 1 | 11.27 | -10.27 |
| 16 | 12 | 9.327 | 2.673 |
| 17 | 18 | 8.631 | 9.369 |
| 18 | 8 | 6.081 | 1.919 |
| 19 | 6 | 4.915 | 1.085 |
| 20 | 1 | 6.541 | -5.541 |
| Ramsey RESET F-Test for powers (2 and 3) of fitted values |
> reset_test_fitted RESET test data: mylm RESET = 6.5274, df1 = 2, df2 = 11, p-value = 0.01352 |
| Ramsey RESET F-Test for powers (2 and 3) of regressors |
> reset_test_regressors RESET test data: mylm RESET = 0.12021, df1 = 12, df2 = 1, p-value = 0.9863 |
| Ramsey RESET F-Test for powers (2 and 3) of principal components |
> reset_test_principal_components RESET test data: mylm RESET = 0.02749, df1 = 2, df2 = 11, p-value = 0.973 |
| Variance Inflation Factors (Multicollinearity) |
> vif Geslacht X1 X2 X3 X4 X5 1.088120 1.516226 1.351035 1.074227 1.381930 1.131159 |