| Multiple Linear Regression - Estimated Regression Equation |
| Score[t] = -18.6605 + 26.9945Geslacht[t] -3.24798X1[t] -0.309166X2[t] -2.31672X3[t] + 0.729851X4[t] + 8.37152X5[t] -8.09407Inter[t] + e[t] |
| Multiple Linear Regression - Ordinary Least Squares | |||||
| Variable | Parameter | S.D. | T-STAT H0: parameter = 0 | 2-tail p-value | 1-tail p-value |
| (Intercept) | -18.66 | 19.51 | -9.5640e-01 | 0.3577 | 0.1789 |
| Geslacht | +26.99 | 28.61 | +9.4360e-01 | 0.364 | 0.182 |
| X1 | -3.248 | 3.297 | -9.8510e-01 | 0.344 | 0.172 |
| X2 | -0.3092 | 2.874 | -1.0760e-01 | 0.9161 | 0.4581 |
| X3 | -2.317 | 3.504 | -6.6110e-01 | 0.521 | 0.2605 |
| X4 | +0.7298 | 3.016 | +2.4200e-01 | 0.8129 | 0.4064 |
| X5 | +8.371 | 6.05 | +1.3840e+00 | 0.1917 | 0.09583 |
| Inter | -8.094 | 8.323 | -9.7250e-01 | 0.35 | 0.175 |
| Multiple Linear Regression - Regression Statistics | |
| Multiple R | 0.5068 |
| R-squared | 0.2569 |
| Adjusted R-squared | -0.1766 |
| F-TEST (value) | 0.5926 |
| F-TEST (DF numerator) | 7 |
| F-TEST (DF denominator) | 12 |
| p-value | 0.7508 |
| Multiple Linear Regression - Residual Statistics | |
| Residual Standard Deviation | 5.444 |
| Sum Squared Residuals | 355.6 |
| Menu of Residual Diagnostics | |
| Description | Link |
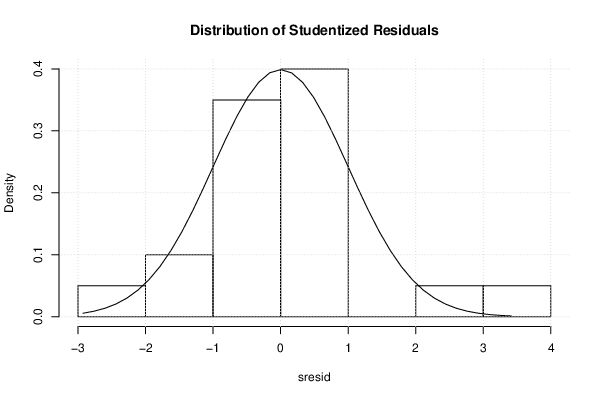
| Histogram | Compute |
| Central Tendency | Compute |
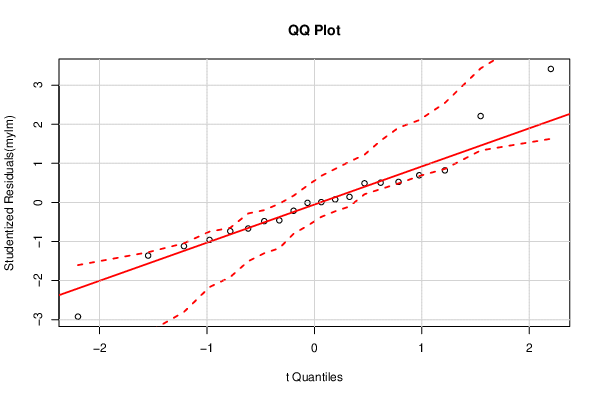
| QQ Plot | Compute |
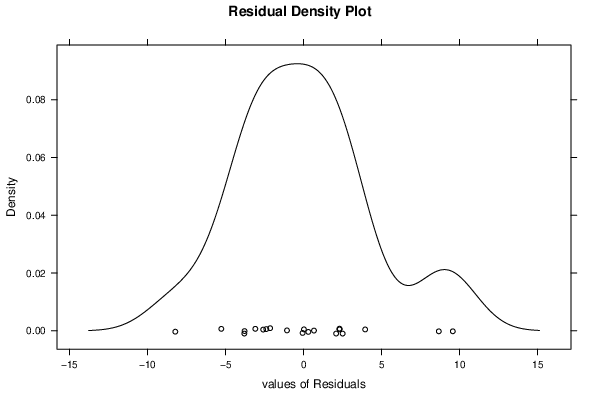
| Kernel Density Plot | Compute |
| Skewness/Kurtosis Test | Compute |
| Skewness-Kurtosis Plot | Compute |
| Harrell-Davis Plot | Compute |
| Bootstrap Plot -- Central Tendency | Compute |
| Blocked Bootstrap Plot -- Central Tendency | Compute |
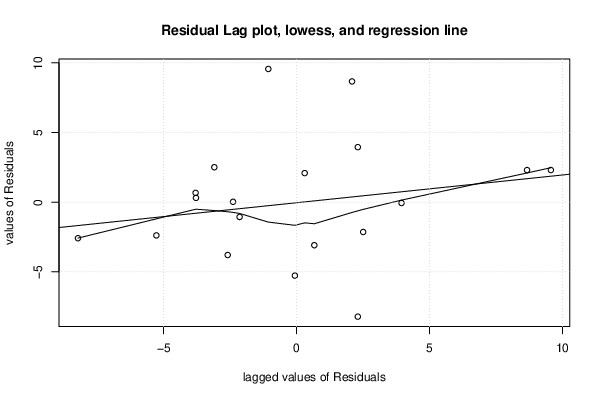
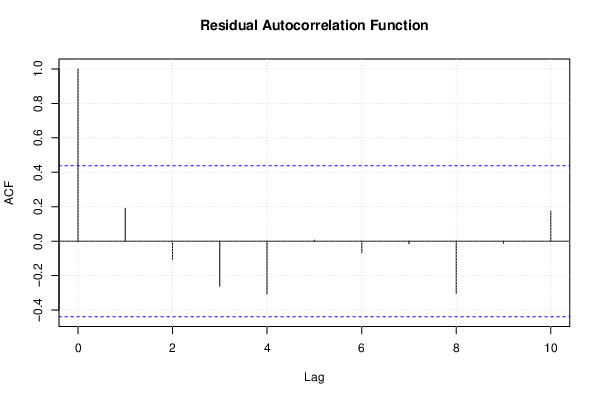
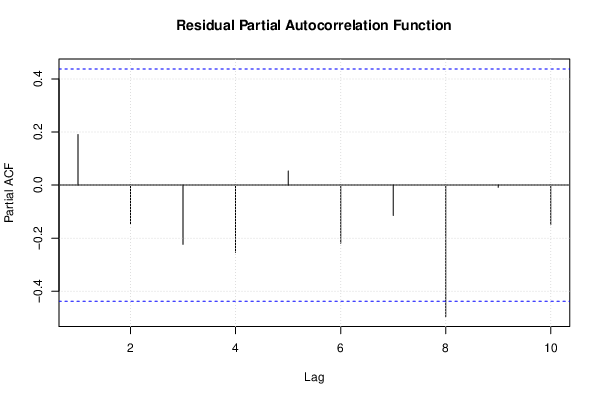
| (Partial) Autocorrelation Plot | Compute |
| Spectral Analysis | Compute |
| Tukey lambda PPCC Plot | Compute |
| Box-Cox Normality Plot | Compute |
| Summary Statistics | Compute |
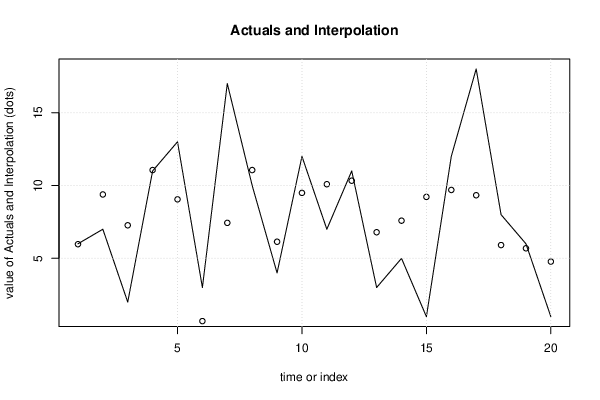
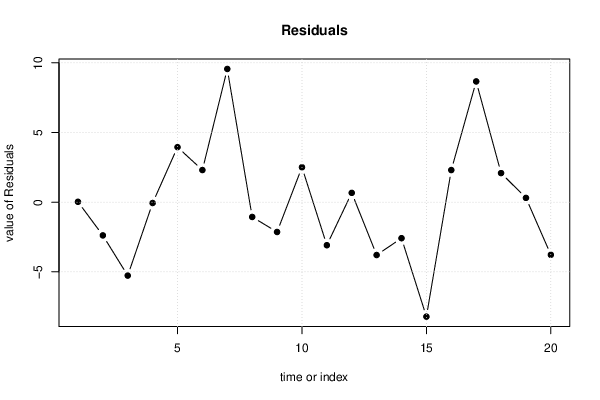
| Multiple Linear Regression - Actuals, Interpolation, and Residuals | |||
| Time or Index | Actuals | Interpolation Forecast | Residuals Prediction Error |
| 1 | 6 | 5.974 | 0.02618 |
| 2 | 7 | 9.386 | -2.386 |
| 3 | 2 | 7.27 | -5.27 |
| 4 | 11 | 11.06 | -0.06051 |
| 5 | 13 | 9.051 | 3.949 |
| 6 | 3 | 0.6946 | 2.305 |
| 7 | 17 | 7.437 | 9.563 |
| 8 | 10 | 11.06 | -1.061 |
| 9 | 4 | 6.14 | -2.14 |
| 10 | 12 | 9.494 | 2.506 |
| 11 | 7 | 10.09 | -3.09 |
| 12 | 11 | 10.33 | 0.6693 |
| 13 | 3 | 6.794 | -3.794 |
| 14 | 5 | 7.587 | -2.587 |
| 15 | 1 | 9.218 | -8.218 |
| 16 | 12 | 9.695 | 2.305 |
| 17 | 18 | 9.333 | 8.667 |
| 18 | 8 | 5.912 | 2.088 |
| 19 | 6 | 5.692 | 0.3076 |
| 20 | 1 | 4.78 | -3.78 |
| Ramsey RESET F-Test for powers (2 and 3) of fitted values |
> reset_test_fitted RESET test data: mylm RESET = 0.31595, df1 = 2, df2 = 10, p-value = 0.7361 |
| Ramsey RESET F-Test for powers (2 and 3) of regressors |
> reset_test_regressors RESET test data: mylm RESET = -0.34274, df1 = 14, df2 = -2, p-value = NA |
| Ramsey RESET F-Test for powers (2 and 3) of principal components |
> reset_test_principal_components RESET test data: mylm RESET = 9.2294, df1 = 2, df2 = 10, p-value = 0.005357 |
| Variance Inflation Factors (Multicollinearity) |
> vif Geslacht X1 X2 X3 X4 X5 Inter 138.083106 1.540826 1.393605 1.553991 1.396834 3.572375 147.159518 |