| Multiple Linear Regression - Estimated Regression Equation |
| Score[t] = -257.794 -44.4619Geslacht[t] -4.8654X1[t] -0.217231X2[t] + 3.22869X3[t] -2.92673X4[t] + 163.222X5[t] -24.6204X6[t] + 13.1261Inter[t] + e[t] |
| Multiple Linear Regression - Ordinary Least Squares | |||||
| Variable | Parameter | S.D. | T-STAT H0: parameter = 0 | 2-tail p-value | 1-tail p-value |
| (Intercept) | -257.8 | 57.75 | -4.4640e+00 | 0.0009567 | 0.0004784 |
| Geslacht | -44.46 | 24.95 | -1.7820e+00 | 0.1023 | 0.05116 |
| X1 | -4.865 | 2.155 | -2.2580e+00 | 0.04529 | 0.02264 |
| X2 | -0.2172 | 1.849 | -1.1750e-01 | 0.9086 | 0.4543 |
| X3 | +3.229 | 2.606 | +1.2390e+00 | 0.2412 | 0.1206 |
| X4 | -2.927 | 2.123 | -1.3780e+00 | 0.1955 | 0.09773 |
| X5 | +163.2 | 36.71 | +4.4460e+00 | 0.0009849 | 0.0004925 |
| X6 | -24.62 | 5.804 | -4.2420e+00 | 0.001384 | 0.0006921 |
| Inter | +13.13 | 7.328 | +1.7910e+00 | 0.1008 | 0.05038 |
| Multiple Linear Regression - Regression Statistics | |
| Multiple R | 0.8474 |
| R-squared | 0.7181 |
| Adjusted R-squared | 0.5131 |
| F-TEST (value) | 3.502 |
| F-TEST (DF numerator) | 8 |
| F-TEST (DF denominator) | 11 |
| p-value | 0.02904 |
| Multiple Linear Regression - Residual Statistics | |
| Residual Standard Deviation | 3.502 |
| Sum Squared Residuals | 134.9 |
| Menu of Residual Diagnostics | |
| Description | Link |
| Histogram | Compute |
| Central Tendency | Compute |
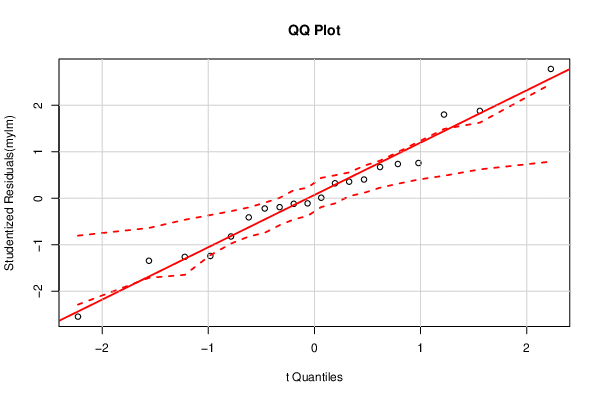
| QQ Plot | Compute |
| Kernel Density Plot | Compute |
| Skewness/Kurtosis Test | Compute |
| Skewness-Kurtosis Plot | Compute |
| Harrell-Davis Plot | Compute |
| Bootstrap Plot -- Central Tendency | Compute |
| Blocked Bootstrap Plot -- Central Tendency | Compute |
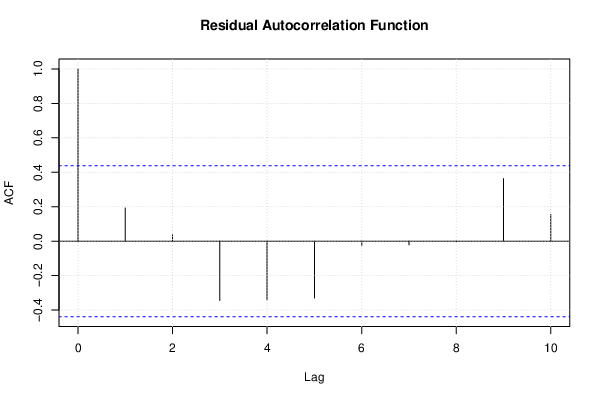
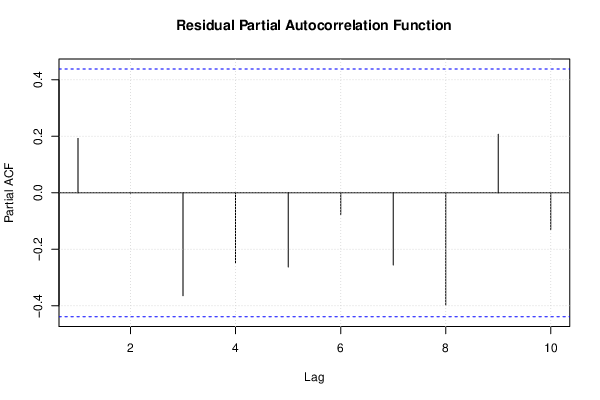
| (Partial) Autocorrelation Plot | Compute |
| Spectral Analysis | Compute |
| Tukey lambda PPCC Plot | Compute |
| Box-Cox Normality Plot | Compute |
| Summary Statistics | Compute |
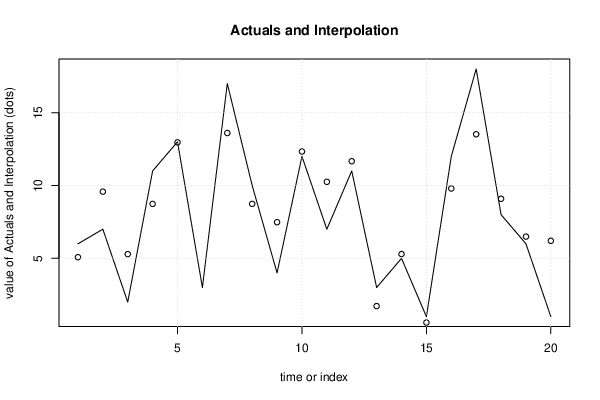
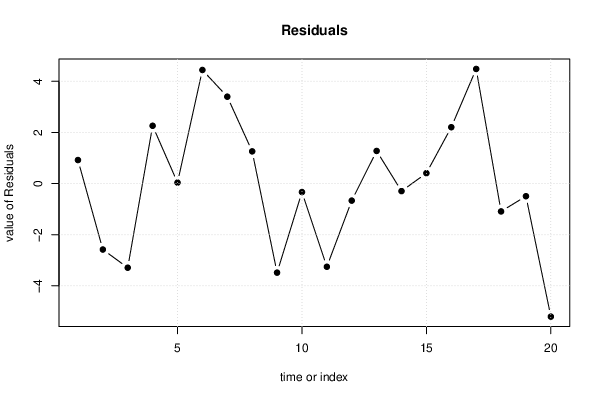
| Multiple Linear Regression - Actuals, Interpolation, and Residuals | |||
| Time or Index | Actuals | Interpolation Forecast | Residuals Prediction Error |
| 1 | 6 | 5.08 | 0.9198 |
| 2 | 7 | 9.579 | -2.579 |
| 3 | 2 | 5.29 | -3.29 |
| 4 | 11 | 8.74 | 2.26 |
| 5 | 13 | 12.96 | 0.03781 |
| 6 | 3 | -1.442 | 4.442 |
| 7 | 17 | 13.6 | 3.398 |
| 8 | 10 | 8.74 | 1.26 |
| 9 | 4 | 7.484 | -3.484 |
| 10 | 12 | 12.33 | -0.3324 |
| 11 | 7 | 10.25 | -3.253 |
| 12 | 11 | 11.67 | -0.6666 |
| 13 | 3 | 1.724 | 1.276 |
| 14 | 5 | 5.295 | -0.2951 |
| 15 | 1 | 0.5933 | 0.4067 |
| 16 | 12 | 9.796 | 2.204 |
| 17 | 18 | 13.52 | 4.483 |
| 18 | 8 | 9.089 | -1.089 |
| 19 | 6 | 6.495 | -0.4945 |
| 20 | 1 | 6.204 | -5.204 |
| Ramsey RESET F-Test for powers (2 and 3) of fitted values |
> reset_test_fitted RESET test data: mylm RESET = 19.324, df1 = 2, df2 = 9, p-value = 0.0005533 |
| Ramsey RESET F-Test for powers (2 and 3) of regressors |
> reset_test_regressors RESET test data: mylm RESET = -0.97854, df1 = 16, df2 = -5, p-value = NA |
| Ramsey RESET F-Test for powers (2 and 3) of principal components |
> reset_test_principal_components RESET test data: mylm RESET = 0.92151, df1 = 2, df2 = 9, p-value = 0.4324 |
| Variance Inflation Factors (Multicollinearity) |
> vif
  Geslacht         X1         X2         X3         X4         X5         X6
253.760008   1.590610   1.393797   2.076499   1.672483 317.781701 370.696086
     Inter
275.595478
|