| Multiple Linear Regression - Estimated Regression Equation |
| Score[t] = + 8.24412 -3.08824X1[t] + 1.06471X2[t] + e[t] |
| Warning: you did not specify the column number of the endogenous series! The first column was selected by default. |
| Multiple Linear Regression - Ordinary Least Squares | |||||
| Variable | Parameter | S.D. | T-STAT H0: parameter = 0 | 2-tail p-value | 1-tail p-value |
| (Intercept) | +8.244 | 2.07 | +3.9830e+00 | 0.0009617 | 0.0004808 |
| X1 | -3.088 | 2.695 | -1.1460e+00 | 0.2676 | 0.1338 |
| X2 | +1.065 | 2.47 | +4.3110e-01 | 0.6718 | 0.3359 |
| Multiple Linear Regression - Regression Statistics | |
| Multiple R | 0.3508 |
| R-squared | 0.123 |
| Adjusted R-squared | 0.01986 |
| F-TEST (value) | 1.192 |
| F-TEST (DF numerator) | 2 |
| F-TEST (DF denominator) | 17 |
| p-value | 0.3276 |
| Multiple Linear Regression - Residual Statistics | |
| Residual Standard Deviation | 4.969 |
| Sum Squared Residuals | 419.7 |
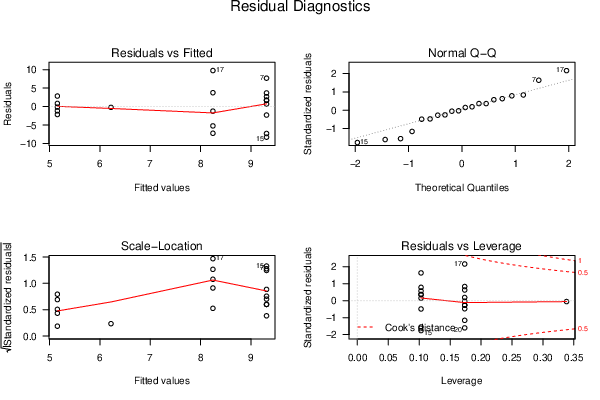
| Menu of Residual Diagnostics | |
| Description | Link |
| Histogram | Compute |
| Central Tendency | Compute |
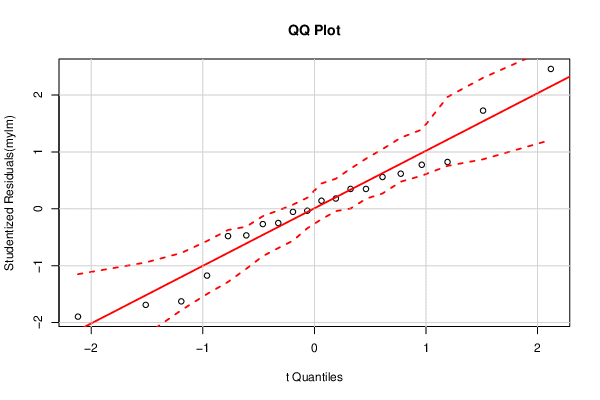
| QQ Plot | Compute |
| Kernel Density Plot | Compute |
| Skewness/Kurtosis Test | Compute |
| Skewness-Kurtosis Plot | Compute |
| Harrell-Davis Plot | Compute |
| Bootstrap Plot -- Central Tendency | Compute |
| Blocked Bootstrap Plot -- Central Tendency | Compute |
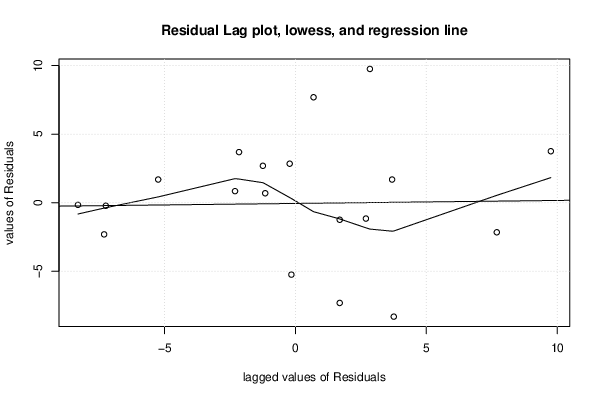
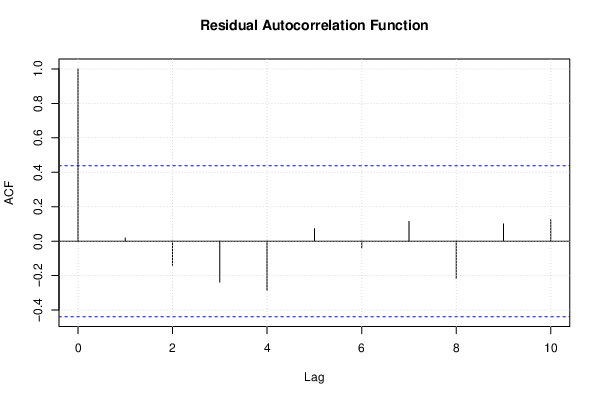
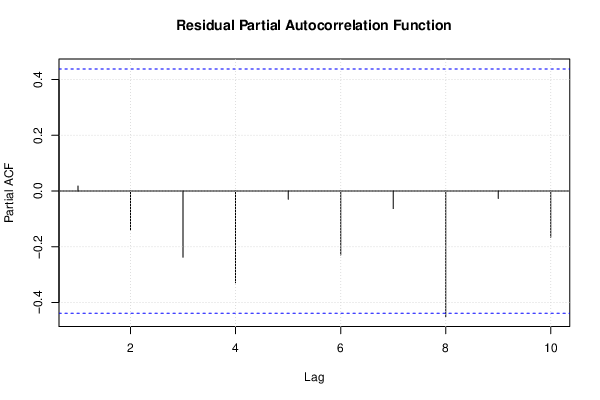
| (Partial) Autocorrelation Plot | Compute |
| Spectral Analysis | Compute |
| Tukey lambda PPCC Plot | Compute |
| Box-Cox Normality Plot | Compute |
| Summary Statistics | Compute |
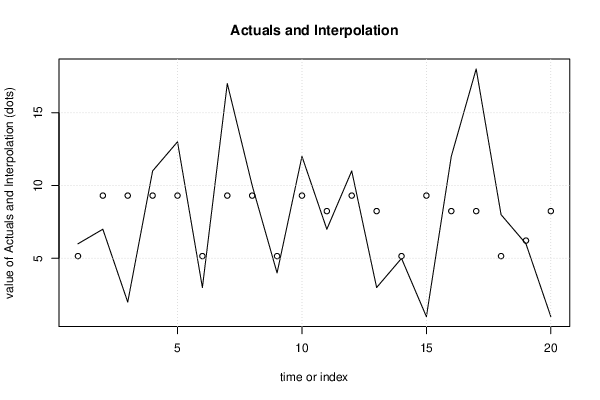
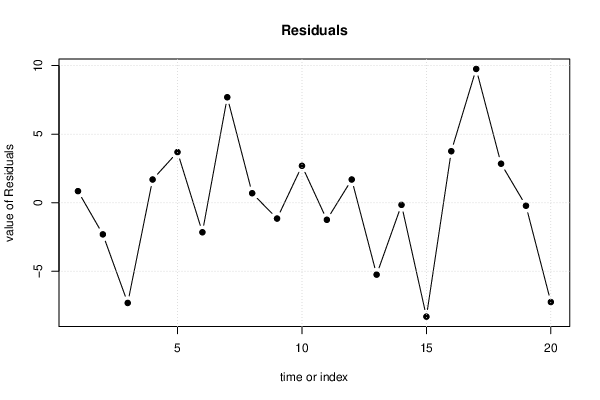
| Multiple Linear Regression - Actuals, Interpolation, and Residuals | |||
| Time or Index | Actuals | Interpolation Forecast | Residuals Prediction Error |
| 1 | 6 | 5.156 | 0.8441 |
| 2 | 7 | 9.309 | -2.309 |
| 3 | 2 | 9.309 | -7.309 |
| 4 | 11 | 9.309 | 1.691 |
| 5 | 13 | 9.309 | 3.691 |
| 6 | 3 | 5.156 | -2.156 |
| 7 | 17 | 9.309 | 7.691 |
| 8 | 10 | 9.309 | 0.6912 |
| 9 | 4 | 5.156 | -1.156 |
| 10 | 12 | 9.309 | 2.691 |
| 11 | 7 | 8.244 | -1.244 |
| 12 | 11 | 9.309 | 1.691 |
| 13 | 3 | 8.244 | -5.244 |
| 14 | 5 | 5.156 | -0.1559 |
| 15 | 1 | 9.309 | -8.309 |
| 16 | 12 | 8.244 | 3.756 |
| 17 | 18 | 8.244 | 9.756 |
| 18 | 8 | 5.156 | 2.844 |
| 19 | 6 | 6.221 | -0.2206 |
| 20 | 1 | 8.244 | -7.244 |
| Ramsey RESET F-Test for powers (2 and 3) of fitted values |
> reset_test_fitted RESET test data: mylm RESET = 0.0013143, df1 = 2, df2 = 15, p-value = 0.9987 |
| Ramsey RESET F-Test for powers (2 and 3) of regressors |
> reset_test_regressors RESET test data: mylm RESET = 0, df1 = 4, df2 = 13, p-value = 1 |
| Ramsey RESET F-Test for powers (2 and 3) of principal components |
> reset_test_principal_components RESET test data: mylm RESET = 0.0013143, df1 = 2, df2 = 15, p-value = 0.9987 |
| Variance Inflation Factors (Multicollinearity) |
> vif
      X1       X2
1.235294 1.235294
|