| Multiple Linear Regression - Estimated Regression Equation |
| Calculation[t] = + 55.3143 + 0.248321Algebraic_Reasoning[t] + 0.193203Graphical_Interpretation[t] + 0.102884Proportionality_and_Ratio[t] + 0.00225489Probability_and_Sampling[t] -0.0272716year[t] + 0.0383029group[t] + 0.031862gender[t] + e[t] |
| Multiple Linear Regression - Ordinary Least Squares | |||||
| Variable | Parameter | S.D. | T-STAT H0: parameter = 0 | 2-tail p-value | 1-tail p-value |
| (Intercept) | +55.31 | 37.66 | +1.4690e+00 | 0.1431 | 0.07153 |
| Algebraic_Reasoning | +0.2483 | 0.05584 | +4.4470e+00 | 1.274e-05 | 6.369e-06 |
| Graphical_Interpretation | +0.1932 | 0.04363 | +4.4280e+00 | 1.382e-05 | 6.908e-06 |
| Proportionality_and_Ratio | +0.1029 | 0.02765 | +3.7200e+00 | 0.000242 | 0.000121 |
| Probability_and_Sampling | +0.002255 | 0.02721 | +8.2880e-02 | 0.934 | 0.467 |
| year | -0.02727 | 0.01872 | -1.4570e+00 | 0.1464 | 0.07319 |
| group | +0.0383 | 0.01859 | +2.0600e+00 | 0.04032 | 0.02016 |
| gender | +0.03186 | 0.01939 | +1.6430e+00 | 0.1016 | 0.0508 |
| Multiple Linear Regression - Regression Statistics | |
| Multiple R | 0.5682 |
| R-squared | 0.3228 |
| Adjusted R-squared | 0.3052 |
| F-TEST (value) | 18.39 |
| F-TEST (DF numerator) | 7 |
| F-TEST (DF denominator) | 270 |
| p-value | 0 |
| Multiple Linear Regression - Residual Statistics | |
| Residual Standard Deviation | 0.1502 |
| Sum Squared Residuals | 6.095 |
| Menu of Residual Diagnostics | |
| Description | Link |
| Histogram | Compute |
| Central Tendency | Compute |
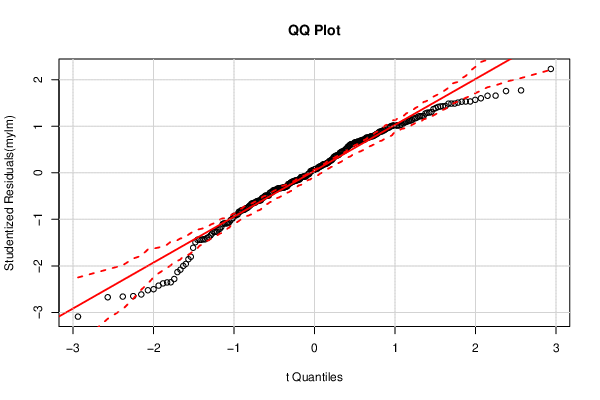
| QQ Plot | Compute |
| Kernel Density Plot | Compute |
| Skewness/Kurtosis Test | Compute |
| Skewness-Kurtosis Plot | Compute |
| Harrell-Davis Plot | Compute |
| Bootstrap Plot -- Central Tendency | Compute |
| Blocked Bootstrap Plot -- Central Tendency | Compute |
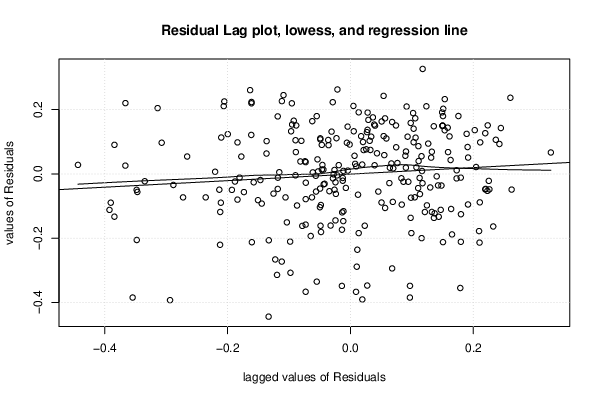
| (Partial) Autocorrelation Plot | Compute |
| Spectral Analysis | Compute |
| Tukey lambda PPCC Plot | Compute |
| Box-Cox Normality Plot | Compute |
| Summary Statistics | Compute |
| Ramsey RESET F-Test for powers (2 and 3) of fitted values |
> reset_test_fitted RESET test data: mylm RESET = 15.84, df1 = 2, df2 = 268, p-value = 3.147e-07 |
| Ramsey RESET F-Test for powers (2 and 3) of regressors |
> reset_test_regressors RESET test data: mylm RESET = 1.6699, df1 = 14, df2 = 256, p-value = 0.06209 |
| Ramsey RESET F-Test for powers (2 and 3) of principal components |
> reset_test_principal_components RESET test data: mylm RESET = 1.7475, df1 = 2, df2 = 268, p-value = 0.1762 |
| Variance Inflation Factors (Multicollinearity) |
> vif
      Algebraic_Reasoning  Graphical_Interpretation Proportionality_and_Ratio
                 1.424253                  1.357782                  1.171012
 Probability_and_Sampling                      year                     group
                 1.241136                  1.038467                  1.063476
                   gender
                 1.136489
|