| Multiple Linear Regression - Estimated Regression Equation |
| ITHSUM[t] = + 7.09805 -0.0609545TVDC[t] + 0.433396SKEOUSUM[t] + e[t] |
| Multiple Linear Regression - Ordinary Least Squares | |||||
| Variable | Parameter | S.D. | T-STAT H0: parameter = 0 | 2-tail p-value | 1-tail p-value |
| (Intercept) | +7.098 | 2.948 | +2.4080e+00 | 0.01796 | 0.00898 |
| TVDC | -0.06095 | 0.1326 | -4.5960e-01 | 0.6468 | 0.3234 |
| SKEOUSUM | +0.4334 | 0.1323 | +3.2760e+00 | 0.001468 | 0.0007338 |
| Multiple Linear Regression - Regression Statistics | |
| Multiple R | 0.3354 |
| R-squared | 0.1125 |
| Adjusted R-squared | 0.09398 |
| F-TEST (value) | 6.083 |
| F-TEST (DF numerator) | 2 |
| F-TEST (DF denominator) | 96 |
| p-value | 0.003256 |
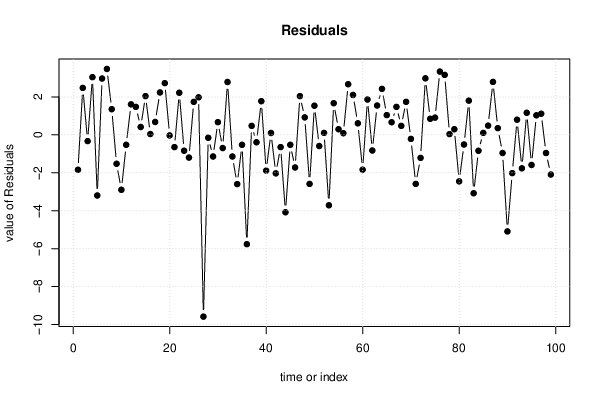
| Multiple Linear Regression - Residual Statistics | |
| Residual Standard Deviation | 2.174 |
| Sum Squared Residuals | 453.9 |
| Menu of Residual Diagnostics | |
| Description | Link |
| Histogram | Compute |
| Central Tendency | Compute |
| QQ Plot | Compute |
| Kernel Density Plot | Compute |
| Skewness/Kurtosis Test | Compute |
| Skewness-Kurtosis Plot | Compute |
| Harrell-Davis Plot | Compute |
| Bootstrap Plot -- Central Tendency | Compute |
| Blocked Bootstrap Plot -- Central Tendency | Compute |
| (Partial) Autocorrelation Plot | Compute |
| Spectral Analysis | Compute |
| Tukey lambda PPCC Plot | Compute |
| Box-Cox Normality Plot | Compute |
| Summary Statistics | Compute |
| Multiple Linear Regression - Actuals, Interpolation, and Residuals | |||
| Time or Index | Actuals | Interpolation Forecast | Residuals Prediction Error |
| 1 | 14 | 15.84 | -1.84 |
| 2 | 19 | 16.52 | 2.476 |
| 3 | 17 | 17.33 | -0.3301 |
| 4 | 20 | 16.96 | 3.042 |
| 5 | 15 | 18.2 | -3.197 |
| 6 | 19 | 16.03 | 2.97 |
| 7 | 20 | 16.52 | 3.476 |
| 8 | 18 | 16.65 | 1.354 |
| 9 | 15 | 16.52 | -1.524 |
| 10 | 14 | 16.9 | -2.897 |
| 11 | 16 | 16.52 | -0.5243 |
| 12 | 19 | 17.39 | 1.609 |
| 13 | 18 | 16.52 | 1.476 |
| 14 | 17 | 16.59 | 0.4148 |
| 15 | 19 | 16.96 | 2.042 |
| 16 | 17 | 16.96 | 0.04233 |
| 17 | 19 | 18.32 | 0.6812 |
| 18 | 20 | 17.76 | 2.236 |
| 19 | 19 | 16.27 | 2.726 |
| 20 | 16 | 16.03 | -0.02993 |
| 21 | 16 | 16.65 | -0.6462 |
| 22 | 18 | 15.78 | 2.221 |
| 23 | 16 | 16.84 | -0.8358 |
| 24 | 17 | 18.2 | -1.197 |
| 25 | 20 | 18.26 | 1.742 |
| 26 | 19 | 17.02 | 1.981 |
| 27 | 7 | 16.59 | -9.585 |
| 28 | 16 | 16.15 | -0.1518 |
| 29 | 16 | 17.14 | -1.141 |
| 30 | 18 | 17.33 | 0.6699 |
| 31 | 17 | 17.7 | -0.6958 |
| 32 | 19 | 16.21 | 2.787 |
| 33 | 16 | 17.14 | -1.141 |
| 34 | 13 | 15.6 | -2.597 |
| 35 | 16 | 16.52 | -0.5243 |
| 36 | 12 | 17.76 | -5.764 |
| 37 | 17 | 16.52 | 0.4757 |
| 38 | 17 | 17.39 | -0.3911 |
| 39 | 17 | 15.22 | 1.776 |
| 40 | 16 | 17.89 | -1.885 |
| 41 | 16 | 15.9 | 0.0987 |
| 42 | 14 | 16.03 | -2.03 |
| 43 | 16 | 16.65 | -0.6462 |
| 44 | 13 | 17.08 | -4.08 |
| 45 | 16 | 16.52 | -0.5243 |
| 46 | 14 | 15.72 | -1.718 |
| 47 | 19 | 16.96 | 2.042 |
| 48 | 18 | 17.08 | 0.9204 |
| 49 | 14 | 16.59 | -2.585 |
| 50 | 18 | 16.46 | 1.537 |
| 51 | 15 | 15.59 | -0.5898 |
| 52 | 17 | 16.9 | 0.1033 |
| 53 | 13 | 16.71 | -3.714 |
| 54 | 19 | 17.33 | 1.67 |
| 55 | 18 | 17.7 | 0.2974 |
| 56 | 15 | 14.91 | 0.0874 |
| 57 | 20 | 17.33 | 2.67 |
| 58 | 19 | 16.9 | 2.103 |
| 59 | 18 | 17.39 | 0.6089 |
| 60 | 15 | 16.84 | -1.836 |
| 61 | 20 | 18.14 | 1.864 |
| 62 | 17 | 17.82 | -0.8245 |
| 63 | 19 | 17.45 | 1.548 |
| 64 | 20 | 17.57 | 2.426 |
| 65 | 18 | 16.96 | 1.042 |
| 66 | 17 | 16.33 | 0.6653 |
| 67 | 18 | 16.52 | 1.476 |
| 68 | 17 | 16.52 | 0.4757 |
| 69 | 20 | 18.26 | 1.742 |
| 70 | 16 | 16.21 | -0.2128 |
| 71 | 14 | 16.59 | -2.585 |
| 72 | 15 | 16.21 | -1.213 |
| 73 | 20 | 17.02 | 2.981 |
| 74 | 17 | 16.15 | 0.8482 |
| 75 | 17 | 16.09 | 0.9091 |
| 76 | 18 | 14.66 | 3.338 |
| 77 | 20 | 16.84 | 3.164 |
| 78 | 16 | 15.96 | 0.03774 |
| 79 | 18 | 17.7 | 0.2974 |
| 80 | 15 | 17.45 | -2.452 |
| 81 | 18 | 18.51 | -0.5084 |
| 82 | 20 | 18.2 | 1.803 |
| 83 | 14 | 17.08 | -3.08 |
| 84 | 15 | 15.84 | -0.8403 |
| 85 | 17 | 16.9 | 0.1033 |
| 86 | 18 | 17.51 | 0.487 |
| 87 | 20 | 17.21 | 2.792 |
| 88 | 17 | 16.65 | 0.3538 |
| 89 | 16 | 16.96 | -0.9577 |
| 90 | 11 | 16.09 | -5.091 |
| 91 | 15 | 17.02 | -2.019 |
| 92 | 18 | 17.2 | 0.7985 |
| 93 | 16 | 17.76 | -1.764 |
| 94 | 18 | 16.84 | 1.164 |
| 95 | 15 | 16.59 | -1.585 |
| 96 | 17 | 15.97 | 1.031 |
| 97 | 19 | 17.89 | 1.115 |
| 98 | 16 | 16.96 | -0.9577 |
| 99 | 14 | 16.09 | -2.091 |
| Goldfeld-Quandt test for Heteroskedasticity | |||
| p-values | Alternative Hypothesis | ||
| breakpoint index | greater | 2-sided | less |
| 6 | 0.6131 | 0.7738 | 0.3869 |
| 7 | 0.5839 | 0.8321 | 0.4161 |
| 8 | 0.5903 | 0.8193 | 0.4097 |
| 9 | 0.6888 | 0.6224 | 0.3112 |
| 10 | 0.8277 | 0.3446 | 0.1723 |
| 11 | 0.7744 | 0.4512 | 0.2256 |
| 12 | 0.7706 | 0.4589 | 0.2294 |
| 13 | 0.7014 | 0.5971 | 0.2986 |
| 14 | 0.6164 | 0.7671 | 0.3836 |
| 15 | 0.5876 | 0.8247 | 0.4124 |
| 16 | 0.5019 | 0.9963 | 0.4981 |
| 17 | 0.4796 | 0.9592 | 0.5204 |
| 18 | 0.4722 | 0.9444 | 0.5278 |
| 19 | 0.4669 | 0.9338 | 0.5331 |
| 20 | 0.4069 | 0.8138 | 0.5931 |
| 21 | 0.3631 | 0.7261 | 0.6369 |
| 22 | 0.3225 | 0.645 | 0.6775 |
| 23 | 0.2788 | 0.5575 | 0.7212 |
| 24 | 0.2321 | 0.4643 | 0.7679 |
| 25 | 0.2188 | 0.4375 | 0.7812 |
| 26 | 0.1929 | 0.3857 | 0.8071 |
| 27 | 0.9897 | 0.02055 | 0.01028 |
| 28 | 0.9847 | 0.03063 | 0.01531 |
| 29 | 0.9797 | 0.04061 | 0.02031 |
| 30 | 0.9713 | 0.05739 | 0.0287 |
| 31 | 0.9602 | 0.07956 | 0.03978 |
| 32 | 0.9646 | 0.07073 | 0.03537 |
| 33 | 0.9546 | 0.09076 | 0.04538 |
| 34 | 0.9625 | 0.07494 | 0.03747 |
| 35 | 0.9494 | 0.1013 | 0.05064 |
| 36 | 0.993 | 0.01409 | 0.007045 |
| 37 | 0.9896 | 0.02084 | 0.01042 |
| 38 | 0.9848 | 0.03038 | 0.01519 |
| 39 | 0.9826 | 0.03481 | 0.0174 |
| 40 | 0.981 | 0.03793 | 0.01896 |
| 41 | 0.9734 | 0.05326 | 0.02663 |
| 42 | 0.9717 | 0.05659 | 0.02829 |
| 43 | 0.9619 | 0.0762 | 0.0381 |
| 44 | 0.9848 | 0.0304 | 0.0152 |
| 45 | 0.9785 | 0.04294 | 0.02147 |
| 46 | 0.9755 | 0.04904 | 0.02452 |
| 47 | 0.9746 | 0.05081 | 0.02541 |
| 48 | 0.9663 | 0.06745 | 0.03372 |
| 49 | 0.9712 | 0.05758 | 0.02879 |
| 50 | 0.9665 | 0.06695 | 0.03347 |
| 51 | 0.9554 | 0.08919 | 0.0446 |
| 52 | 0.9395 | 0.1209 | 0.06045 |
| 53 | 0.9669 | 0.06614 | 0.03307 |
| 54 | 0.962 | 0.07598 | 0.03799 |
| 55 | 0.9486 | 0.1029 | 0.05144 |
| 56 | 0.9309 | 0.1383 | 0.06913 |
| 57 | 0.9397 | 0.1207 | 0.06034 |
| 58 | 0.9385 | 0.123 | 0.06151 |
| 59 | 0.919 | 0.1619 | 0.08096 |
| 60 | 0.9137 | 0.1725 | 0.08627 |
| 61 | 0.9049 | 0.1903 | 0.09514 |
| 62 | 0.8823 | 0.2355 | 0.1177 |
| 63 | 0.8644 | 0.2712 | 0.1356 |
| 64 | 0.874 | 0.252 | 0.126 |
| 65 | 0.8464 | 0.3073 | 0.1536 |
| 66 | 0.8119 | 0.3762 | 0.1881 |
| 67 | 0.7873 | 0.4255 | 0.2127 |
| 68 | 0.7394 | 0.5212 | 0.2606 |
| 69 | 0.7258 | 0.5483 | 0.2742 |
| 70 | 0.6681 | 0.6639 | 0.3319 |
| 71 | 0.6889 | 0.6222 | 0.3111 |
| 72 | 0.6455 | 0.709 | 0.3545 |
| 73 | 0.71 | 0.5801 | 0.29 |
| 74 | 0.6569 | 0.6861 | 0.3431 |
| 75 | 0.6002 | 0.7995 | 0.3998 |
| 76 | 0.7836 | 0.4328 | 0.2164 |
| 77 | 0.8618 | 0.2764 | 0.1382 |
| 78 | 0.8524 | 0.2953 | 0.1476 |
| 79 | 0.8018 | 0.3964 | 0.1982 |
| 80 | 0.8071 | 0.3858 | 0.1929 |
| 81 | 0.805 | 0.3901 | 0.195 |
| 82 | 0.7525 | 0.4949 | 0.2475 |
| 83 | 0.788 | 0.424 | 0.212 |
| 84 | 0.7532 | 0.4936 | 0.2468 |
| 85 | 0.6739 | 0.6522 | 0.3261 |
| 86 | 0.5895 | 0.8209 | 0.4105 |
| 87 | 0.633 | 0.7339 | 0.367 |
| 88 | 0.5828 | 0.8344 | 0.4172 |
| 89 | 0.4725 | 0.9451 | 0.5275 |
| 90 | 0.7568 | 0.4864 | 0.2432 |
| 91 | 0.7202 | 0.5596 | 0.2798 |
| 92 | 0.7092 | 0.5815 | 0.2908 |
| 93 | 0.9238 | 0.1525 | 0.07625 |
| Meta Analysis of Goldfeld-Quandt test for Heteroskedasticity | |||
| Description | # significant tests | % significant tests | OK/NOK |
| 1% type I error level | 0 | 0 | OK |
| 5% type I error level | 11 | 0.125 | NOK |
| 10% type I error level | 26 | 0.295455 | NOK |
| Ramsey RESET F-Test for powers (2 and 3) of fitted values |
> reset_test_fitted RESET test data: mylm RESET = 1.0906, df1 = 2, df2 = 94, p-value = 0.3402 |
| Ramsey RESET F-Test for powers (2 and 3) of regressors |
> reset_test_regressors RESET test data: mylm RESET = 0.83118, df1 = 4, df2 = 92, p-value = 0.5087 |
| Ramsey RESET F-Test for powers (2 and 3) of principal components |
> reset_test_principal_components RESET test data: mylm RESET = 1.2135, df1 = 2, df2 = 94, p-value = 0.3018 |
| Variance Inflation Factors (Multicollinearity) |
> vif
    TVDC SKEOUSUM
1.274892 1.274892
|