| Multiple Linear Regression - Estimated Regression Equation |
| [t] = + 3322.01 + 0.128828`F1C(t-1)`[t] -0.248037`F1C(t-2)`[t] + 0.0153302`F1C(t-3)`[t] -0.0929215`F1C(t-4)`[t] -0.0976214`F1C(t-5)`[t] -0.0475415`F1C(t-6)`[t] -0.0798657`F1C(t-7)`[t] + 0.0636949`F1C(t-8)`[t] -0.00833499`F1C(t-9)`[t] + 0.222908`F1C(t-10)`[t] + 0.00887549`F1C(t-11)`[t] -0.283728`F1C(t-12)`[t] + 489.948M1[t] + 781.735M2[t] + 746.321M3[t] + 258.598M4[t] -150.416M5[t] -339.192M6[t] -463.056M7[t] -808.364M8[t] -990.457M9[t] -921.372M10[t] -868.529M11[t] -7.77076t + e[t] |
| Warning: you did not specify the column number of the endogenous series! The first column was selected by default. |
| Multiple Linear Regression - Ordinary Least Squares | |||||
| Variable | Parameter | S.D. | T-STAT H0: parameter = 0 | 2-tail p-value | 1-tail p-value |
| (Intercept) | +3322 | 1546 | +2.1480e+00 | 0.0387 | 0.01935 |
| `F1C(t-1)` | +0.1288 | 0.1688 | +7.6330e-01 | 0.4504 | 0.2252 |
| `F1C(t-2)` | -0.248 | 0.1685 | -1.4720e+00 | 0.15 | 0.07498 |
| `F1C(t-3)` | +0.01533 | 0.1702 | +9.0090e-02 | 0.9287 | 0.4644 |
| `F1C(t-4)` | -0.09292 | 0.1713 | -5.4260e-01 | 0.5909 | 0.2954 |
| `F1C(t-5)` | -0.09762 | 0.1721 | -5.6740e-01 | 0.5741 | 0.287 |
| `F1C(t-6)` | -0.04754 | 0.1724 | -2.7570e-01 | 0.7844 | 0.3922 |
| `F1C(t-7)` | -0.07987 | 0.1722 | -4.6390e-01 | 0.6456 | 0.3228 |
| `F1C(t-8)` | +0.0637 | 0.1725 | +3.6930e-01 | 0.7141 | 0.3571 |
| `F1C(t-9)` | -0.008335 | 0.1725 | -4.8320e-02 | 0.9617 | 0.4809 |
| `F1C(t-10)` | +0.2229 | 0.1724 | +1.2930e+00 | 0.2044 | 0.1022 |
| `F1C(t-11)` | +0.008875 | 0.1616 | +5.4920e-02 | 0.9565 | 0.4783 |
| `F1C(t-12)` | -0.2837 | 0.1613 | -1.7590e+00 | 0.08727 | 0.04363 |
| M1 | +489.9 | 249 | +1.9680e+00 | 0.05707 | 0.02854 |
| M2 | +781.7 | 382.6 | +2.0430e+00 | 0.04861 | 0.0243 |
| M3 | +746.3 | 516.2 | +1.4460e+00 | 0.1571 | 0.07857 |
| M4 | +258.6 | 607.9 | +4.2540e-01 | 0.6732 | 0.3366 |
| M5 | -150.4 | 639 | -2.3540e-01 | 0.8153 | 0.4076 |
| M6 | -339.2 | 624.2 | -5.4340e-01 | 0.5903 | 0.2951 |
| M7 | -463.1 | 584.5 | -7.9230e-01 | 0.4335 | 0.2168 |
| M8 | -808.4 | 525.9 | -1.5370e+00 | 0.1332 | 0.06662 |
| M9 | -990.5 | 435.9 | -2.2720e+00 | 0.02932 | 0.01466 |
| M10 | -921.4 | 318.2 | -2.8960e+00 | 0.006479 | 0.00324 |
| M11 | -868.5 | 213 | -4.0780e+00 | 0.0002488 | 0.0001244 |
| t | -7.771 | 4.247 | -1.8300e+00 | 0.0758 | 0.0379 |
| Multiple Linear Regression - Regression Statistics | |
| Multiple R | 0.959 |
| R-squared | 0.9196 |
| Adjusted R-squared | 0.8645 |
| F-TEST (value) | 16.69 |
| F-TEST (DF numerator) | 24 |
| F-TEST (DF denominator) | 35 |
| p-value | 7.895e-13 |
| Multiple Linear Regression - Residual Statistics | |
| Residual Standard Deviation | 232.3 |
| Sum Squared Residuals | 1.889e+06 |
| Menu of Residual Diagnostics | |
| Description | Link |
| Histogram | Compute |
| Central Tendency | Compute |
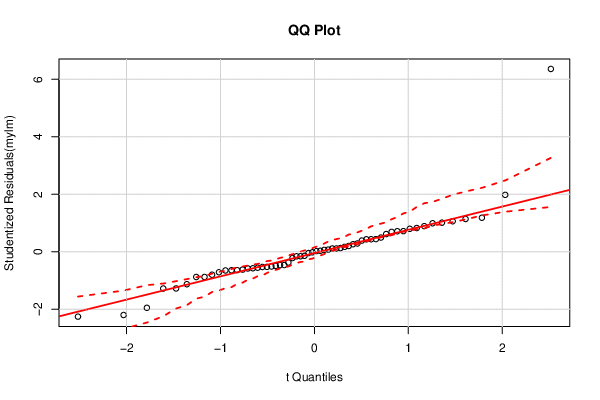
| QQ Plot | Compute |
| Kernel Density Plot | Compute |
| Skewness/Kurtosis Test | Compute |
| Skewness-Kurtosis Plot | Compute |
| Harrell-Davis Plot | Compute |
| Bootstrap Plot -- Central Tendency | Compute |
| Blocked Bootstrap Plot -- Central Tendency | Compute |
| (Partial) Autocorrelation Plot | Compute |
| Spectral Analysis | Compute |
| Tukey lambda PPCC Plot | Compute |
| Box-Cox Normality Plot | Compute |
| Summary Statistics | Compute |
| Multiple Linear Regression - Actuals, Interpolation, and Residuals | |||
| Time or Index | Actuals | Interpolation Forecast | Residuals Prediction Error |
| 1 | 2933 | 2974 | -41.36 |
| 2 | 2889 | 3276 | -387.1 |
| 3 | 2938 | 2924 | 13.95 |
| 4 | 2497 | 2327 | 169.9 |
| 5 | 1870 | 1898 | -27.87 |
| 6 | 1726 | 1757 | -31.18 |
| 7 | 1607 | 1710 | -103 |
| 8 | 1545 | 1554 | -9.376 |
| 9 | 1396 | 1522 | -126.2 |
| 10 | 1787 | 1598 | 188.5 |
| 11 | 2076 | 1885 | 191.3 |
| 12 | 2837 | 2634 | 202.6 |
| 13 | 2787 | 3041 | -253.8 |
| 14 | 3891 | 3035 | 855.6 |
| 15 | 3179 | 2942 | 237.5 |
| 16 | 2011 | 2059 | -47.58 |
| 17 | 1636 | 1711 | -75.36 |
| 18 | 1580 | 1640 | -60.46 |
| 19 | 1489 | 1492 | -2.853 |
| 20 | 1300 | 1414 | -114.2 |
| 21 | 1356 | 1417 | -60.91 |
| 22 | 1653 | 1817 | -164.1 |
| 23 | 2013 | 1868 | 145.2 |
| 24 | 2823 | 2722 | 100.6 |
| 25 | 3102 | 3097 | 4.625 |
| 26 | 2294 | 2625 | -330.8 |
| 27 | 2385 | 2473 | -88.43 |
| 28 | 2444 | 2370 | 74.35 |
| 29 | 1748 | 1870 | -122.4 |
| 30 | 1554 | 1543 | 11.03 |
| 31 | 1498 | 1609 | -111.4 |
| 32 | 1361 | 1457 | -96.27 |
| 33 | 1346 | 1458 | -111.8 |
| 34 | 1564 | 1672 | -107.9 |
| 35 | 1640 | 1779 | -139 |
| 36 | 2293 | 2274 | 19.24 |
| 37 | 2815 | 2747 | 68.39 |
| 38 | 3137 | 3166 | -28.92 |
| 39 | 2679 | 2846 | -166.7 |
| 40 | 1969 | 2068 | -98.63 |
| 41 | 1870 | 1728 | 141.9 |
| 42 | 1633 | 1608 | 25.1 |
| 43 | 1529 | 1408 | 121.1 |
| 44 | 1366 | 1281 | 85.32 |
| 45 | 1357 | 1217 | 139.5 |
| 46 | 1570 | 1519 | 50.96 |
| 47 | 1535 | 1754 | -219.2 |
| 48 | 2491 | 2452 | 39.29 |
| 49 | 3084 | 2862 | 222.1 |
| 50 | 2605 | 2714 | -108.8 |
| 51 | 2573 | 2569 | 3.669 |
| 52 | 2143 | 2241 | -98.02 |
| 53 | 1693 | 1609 | 83.76 |
| 54 | 1504 | 1448 | 55.52 |
| 55 | 1461 | 1365 | 96.24 |
| 56 | 1354 | 1219 | 134.6 |
| 57 | 1333 | 1174 | 159.4 |
| 58 | 1492 | 1459 | 32.54 |
| 59 | 1781 | 1759 | 21.67 |
| 60 | 1915 | 2277 | -361.7 |
| Goldfeld-Quandt test for Heteroskedasticity | |||
| p-values | Alternative Hypothesis | ||
| breakpoint index | greater | 2-sided | less |
| 28 | 0.9996 | 0.0007376 | 0.0003688 |
| 29 | 0.9982 | 0.003624 | 0.001812 |
| 30 | 0.9919 | 0.01619 | 0.008093 |
| 31 | 0.9718 | 0.05633 | 0.02817 |
| 32 | 0.9135 | 0.1731 | 0.08655 |
| Meta Analysis of Goldfeld-Quandt test for Heteroskedasticity | |||
| Description | # significant tests | % significant tests | OK/NOK |
| 1% type I error level | 2 | 0.4 | NOK |
| 5% type I error level | 3 | 0.6 | NOK |
| 10% type I error level | 4 | 0.8 | NOK |
| Ramsey RESET F-Test for powers (2 and 3) of fitted values |
> reset_test_fitted RESET test data: mylm RESET = 7.0456, df1 = 2, df2 = 33, p-value = 0.002831 |
| Ramsey RESET F-Test for powers (2 and 3) of regressors |
> reset_test_regressors RESET test data: mylm RESET = -0.43364, df1 = 48, df2 = -13, p-value = NA |
| Ramsey RESET F-Test for powers (2 and 3) of principal components |
> reset_test_principal_components RESET test data: mylm RESET = 0.40428, df1 = 2, df2 = 33, p-value = 0.6707 |
| Variance Inflation Factors (Multicollinearity) |
> vif
 `F1C(t-1)`  `F1C(t-2)`  `F1C(t-3)`  `F1C(t-4)`  `F1C(t-5)`  `F1C(t-6)`
  12.518333   12.453451   12.529724   12.522414   12.521569   12.442948
 `F1C(t-7)`  `F1C(t-8)`  `F1C(t-9)` `F1C(t-10)` `F1C(t-11)` `F1C(t-12)`
  12.321787   12.285902   12.411126   12.471964   10.935649   10.845821
         M1          M2          M3          M4          M5          M6
   5.266731   12.433374   22.635058   31.390465   34.680240   33.091501
         M7          M8          M9         M10         M11           t
  29.015216   23.490252   16.138635    8.600256    3.852449    6.014358
|