| Multiple Linear Regression - Estimated Regression Equation |
| Score[t] = -180.407 -3.3834X1[t] + 109.085X5[t] -15.5222X6[t] + e[t] |
| Multiple Linear Regression - Ordinary Least Squares | |||||
| Variable | Parameter | S.D. | T-STAT H0: parameter = 0 | 2-tail p-value | 1-tail p-value |
| (Intercept) | -180.4 | 43.83 | -4.1160e+00 | 0.0008088 | 0.0004044 |
| X1 | -3.383 | 1.685 | -2.0080e+00 | 0.06181 | 0.03091 |
| X5 | +109.1 | 25.81 | +4.2270e+00 | 0.000641 | 0.0003205 |
| X6 | -15.52 | 3.777 | -4.1090e+00 | 0.0008202 | 0.0004101 |
| Multiple Linear Regression - Regression Statistics | |
| Multiple R | 0.7759 |
| R-squared | 0.602 |
| Adjusted R-squared | 0.5274 |
| F-TEST (value) | 8.067 |
| F-TEST (DF numerator) | 3 |
| F-TEST (DF denominator) | 16 |
| p-value | 0.001689 |
| Multiple Linear Regression - Residual Statistics | |
| Residual Standard Deviation | 3.45 |
| Sum Squared Residuals | 190.5 |
| Menu of Residual Diagnostics | |
| Description | Link |
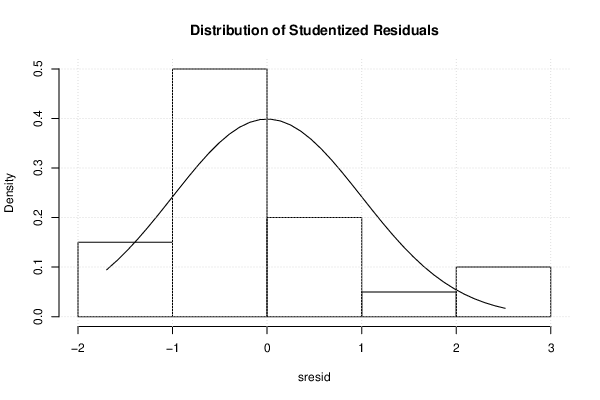
| Histogram | Compute |
| Central Tendency | Compute |
| QQ Plot | Compute |
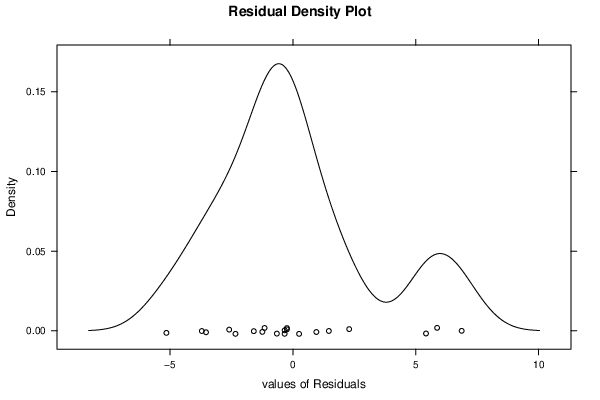
| Kernel Density Plot | Compute |
| Skewness/Kurtosis Test | Compute |
| Skewness-Kurtosis Plot | Compute |
| Harrell-Davis Plot | Compute |
| Bootstrap Plot -- Central Tendency | Compute |
| Blocked Bootstrap Plot -- Central Tendency | Compute |
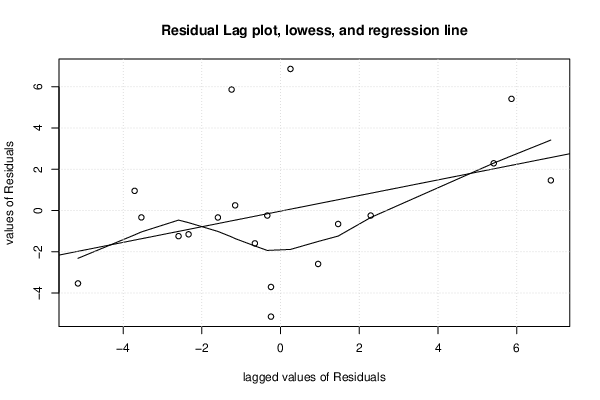
| (Partial) Autocorrelation Plot | Compute |
| Spectral Analysis | Compute |
| Tukey lambda PPCC Plot | Compute |
| Box-Cox Normality Plot | Compute |
| Summary Statistics | Compute |
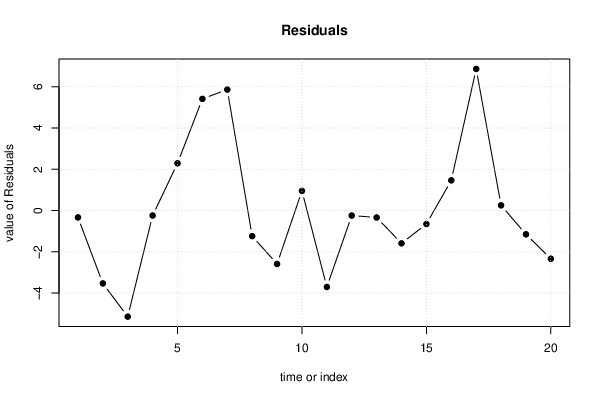
| Multiple Linear Regression - Actuals, Interpolation, and Residuals | |||
| Time or Index | Actuals | Interpolation Forecast | Residuals Prediction Error |
| 1 | 6 | 6.334 | -0.334 |
| 2 | 7 | 10.54 | -3.536 |
| 3 | 2 | 7.148 | -5.148 |
| 4 | 11 | 11.24 | -0.2432 |
| 5 | 13 | 10.71 | 2.292 |
| 6 | 3 | -2.418 | 5.418 |
| 7 | 17 | 11.13 | 5.869 |
| 8 | 10 | 11.24 | -1.243 |
| 9 | 4 | 6.592 | -2.592 |
| 10 | 12 | 11.05 | 0.9549 |
| 11 | 7 | 10.71 | -3.708 |
| 12 | 11 | 11.24 | -0.2432 |
| 13 | 3 | 3.337 | -0.3368 |
| 14 | 5 | 6.592 | -1.592 |
| 15 | 1 | 1.652 | -0.6525 |
| 16 | 12 | 10.54 | 1.464 |
| 17 | 18 | 11.13 | 6.869 |
| 18 | 8 | 7.748 | 0.2525 |
| 19 | 6 | 7.153 | -1.153 |
| 20 | 1 | 3.337 | -2.337 |
| Ramsey RESET F-Test for powers (2 and 3) of fitted values |
> reset_test_fitted RESET test data: mylm RESET = 5.4673, df1 = 2, df2 = 14, p-value = 0.01759 |
| Ramsey RESET F-Test for powers (2 and 3) of regressors |
> reset_test_regressors RESET test data: mylm RESET = 1.3331, df1 = 6, df2 = 10, p-value = 0.3274 |
| Ramsey RESET F-Test for powers (2 and 3) of principal components |
> reset_test_principal_components RESET test data: mylm RESET = 5.0754, df1 = 2, df2 = 14, p-value = 0.022 |
| Variance Inflation Factors (Multicollinearity) |
> vif
        X1         X5         X6
  1.001466 161.779742 161.764243
|