Free Statistics

of Irreproducible Research!

Author's title

Author*Unverified author*
R Software Modulerwasp_cross.wasp
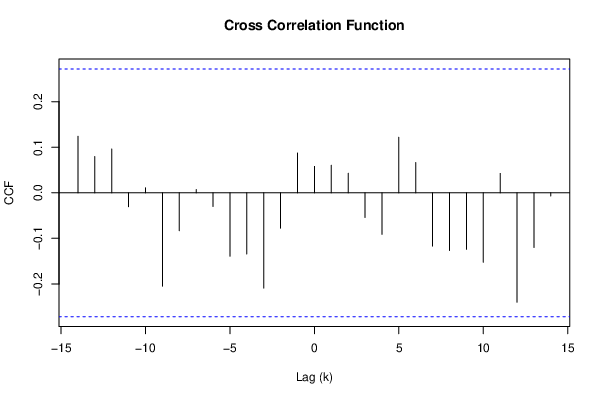
Title produced by softwareCross Correlation Function
Date of computationWed, 17 Jul 2019 23:17:53 +0200
Cite this page as followsStatistical Computations at FreeStatistics.org, Office for Research Development and Education, URL https://freestatistics.org/blog/index.php?v=date/2019/Jul/17/t1563398355au7z4pjvh90plix.htm/, Retrieved Sat, 20 Apr 2024 18:41:13 +0200
Statistical Computations at FreeStatistics.org, Office for Research Development and Education, URL https://freestatistics.org/blog/index.php?pk=, Retrieved Sat, 20 Apr 2024 18:41:13 +0200
QR Codes:

Original text written by user:
IsPrivate?This computation is private
User-defined keywords
Estimated Impact0
Dataseries X:
161
184
261
379
400
246
245
461
227
178
357
303
383
197
328
279
234
274
324
475
224
444
885
563
278
97
176
270
261
213
405
278
431
216
498
552
650
492
478
371
277
398
237
205
360
299
252
623
308
377
825
219
Dataseries Y:
1
12
6
25
13
15
9
10
8
7
6
12
10
14
7
4
10
27
3
9
7
6
8
9
6
5
3
7
5
11
15
1
3
11
13
8
13
5
7
9
7
3
9
5
8
2
11
11
5
8
9
22


Summary of computational transaction
Raw Input view raw input (R code)
Raw Outputview raw output of R engine
Computing time1 seconds
R ServerBig Analytics Cloud Computing Center

\begin{tabular}{lllllllll}
\hline
Summary of computational transaction \tabularnewline
Raw Input view raw input (R code)  \tabularnewline
Raw Outputview raw output of R engine  \tabularnewline
Computing time1 seconds \tabularnewline
R ServerBig Analytics Cloud Computing Center \tabularnewline
\hline
\end{tabular}
%Source: https://freestatistics.org/blog/index.php?pk=&T=0

[TABLE]
[ROW]
Summary of computational transaction[/C][/ROW] [ROW]Raw Input[/C] view raw input (R code) [/C][/ROW] [ROW]Raw Output[/C]view raw output of R engine [/C][/ROW] [ROW]Computing time[/C]1 seconds[/C][/ROW] [ROW]R Server[/C]Big Analytics Cloud Computing Center[/C][/ROW] [/TABLE] Source: https://freestatistics.org/blog/index.php?pk=&T=0

Globally Unique Identifier (entire table): ba.freestatistics.org/blog/index.php?pk=&T=0

As an alternative you can also use a QR Code:  

The GUIDs for individual cells are displayed in the table below:

Summary of computational transaction
Raw Input view raw input (R code)
Raw Outputview raw output of R engine
Computing time1 seconds
R ServerBig Analytics Cloud Computing Center


Cross Correlation Function
ParameterValue
Box-Cox transformation parameter (lambda) of X series1
Degree of non-seasonal differencing (d) of X series0
Degree of seasonal differencing (D) of X series0
Seasonal Period (s)1
Box-Cox transformation parameter (lambda) of Y series1
Degree of non-seasonal differencing (d) of Y series0
Degree of seasonal differencing (D) of Y series0
krho(Y[t],X[t+k])
-140.124136035054624
-130.0794594846661588
-120.0961387548735791
-11-0.0304360463516121
-100.0108362741441395
-9-0.205122745258631
-8-0.0833363143744791
-70.00704352324022379
-6-0.0299059514712282
-5-0.139314732155657
-4-0.13403631427326
-3-0.209061260233581
-2-0.0775929901618447
-10.0871535882630129
00.057908864382633
10.0604664674254391
20.0427772211876593
3-0.054203626874805
4-0.0910725947572029
50.121705580595929
60.0663105625580584
7-0.116904914416664
8-0.126465237750497
9-0.124110344308833
10-0.152458364992565
110.0426153145357136
12-0.240102000796936
13-0.119821913133199
14-0.00699296605064719

\begin{tabular}{lllllllll}
\hline
Cross Correlation Function \tabularnewline
Parameter & Value \tabularnewline
Box-Cox transformation parameter (lambda) of X series & 1 \tabularnewline
Degree of non-seasonal differencing (d) of X series & 0 \tabularnewline
Degree of seasonal differencing (D) of X series & 0 \tabularnewline
Seasonal Period (s) & 1 \tabularnewline
Box-Cox transformation parameter (lambda) of Y series & 1 \tabularnewline
Degree of non-seasonal differencing (d) of Y series & 0 \tabularnewline
Degree of seasonal differencing (D) of Y series & 0 \tabularnewline
k & rho(Y[t],X[t+k]) \tabularnewline
-14 & 0.124136035054624 \tabularnewline
-13 & 0.0794594846661588 \tabularnewline
-12 & 0.0961387548735791 \tabularnewline
-11 & -0.0304360463516121 \tabularnewline
-10 & 0.0108362741441395 \tabularnewline
-9 & -0.205122745258631 \tabularnewline
-8 & -0.0833363143744791 \tabularnewline
-7 & 0.00704352324022379 \tabularnewline
-6 & -0.0299059514712282 \tabularnewline
-5 & -0.139314732155657 \tabularnewline
-4 & -0.13403631427326 \tabularnewline
-3 & -0.209061260233581 \tabularnewline
-2 & -0.0775929901618447 \tabularnewline
-1 & 0.0871535882630129 \tabularnewline
0 & 0.057908864382633 \tabularnewline
1 & 0.0604664674254391 \tabularnewline
2 & 0.0427772211876593 \tabularnewline
3 & -0.054203626874805 \tabularnewline
4 & -0.0910725947572029 \tabularnewline
5 & 0.121705580595929 \tabularnewline
6 & 0.0663105625580584 \tabularnewline
7 & -0.116904914416664 \tabularnewline
8 & -0.126465237750497 \tabularnewline
9 & -0.124110344308833 \tabularnewline
10 & -0.152458364992565 \tabularnewline
11 & 0.0426153145357136 \tabularnewline
12 & -0.240102000796936 \tabularnewline
13 & -0.119821913133199 \tabularnewline
14 & -0.00699296605064719 \tabularnewline
\hline
\end{tabular}
%Source: https://freestatistics.org/blog/index.php?pk=&T=1

[TABLE]
[ROW][C]Cross Correlation Function[/C][/ROW]
[ROW][C]Parameter[/C][C]Value[/C][/ROW]
[ROW][C]Box-Cox transformation parameter (lambda) of X series[/C][C]1[/C][/ROW]
[ROW][C]Degree of non-seasonal differencing (d) of X series[/C][C]0[/C][/ROW]
[ROW][C]Degree of seasonal differencing (D) of X series[/C][C]0[/C][/ROW]
[ROW][C]Seasonal Period (s)[/C][C]1[/C][/ROW]
[ROW][C]Box-Cox transformation parameter (lambda) of Y series[/C][C]1[/C][/ROW]
[ROW][C]Degree of non-seasonal differencing (d) of Y series[/C][C]0[/C][/ROW]
[ROW][C]Degree of seasonal differencing (D) of Y series[/C][C]0[/C][/ROW]
[ROW][C]k[/C][C]rho(Y[t],X[t+k])[/C][/ROW]
[ROW][C]-14[/C][C]0.124136035054624[/C][/ROW]
[ROW][C]-13[/C][C]0.0794594846661588[/C][/ROW]
[ROW][C]-12[/C][C]0.0961387548735791[/C][/ROW]
[ROW][C]-11[/C][C]-0.0304360463516121[/C][/ROW]
[ROW][C]-10[/C][C]0.0108362741441395[/C][/ROW]
[ROW][C]-9[/C][C]-0.205122745258631[/C][/ROW]
[ROW][C]-8[/C][C]-0.0833363143744791[/C][/ROW]
[ROW][C]-7[/C][C]0.00704352324022379[/C][/ROW]
[ROW][C]-6[/C][C]-0.0299059514712282[/C][/ROW]
[ROW][C]-5[/C][C]-0.139314732155657[/C][/ROW]
[ROW][C]-4[/C][C]-0.13403631427326[/C][/ROW]
[ROW][C]-3[/C][C]-0.209061260233581[/C][/ROW]
[ROW][C]-2[/C][C]-0.0775929901618447[/C][/ROW]
[ROW][C]-1[/C][C]0.0871535882630129[/C][/ROW]
[ROW][C]0[/C][C]0.057908864382633[/C][/ROW]
[ROW][C]1[/C][C]0.0604664674254391[/C][/ROW]
[ROW][C]2[/C][C]0.0427772211876593[/C][/ROW]
[ROW][C]3[/C][C]-0.054203626874805[/C][/ROW]
[ROW][C]4[/C][C]-0.0910725947572029[/C][/ROW]
[ROW][C]5[/C][C]0.121705580595929[/C][/ROW]
[ROW][C]6[/C][C]0.0663105625580584[/C][/ROW]
[ROW][C]7[/C][C]-0.116904914416664[/C][/ROW]
[ROW][C]8[/C][C]-0.126465237750497[/C][/ROW]
[ROW][C]9[/C][C]-0.124110344308833[/C][/ROW]
[ROW][C]10[/C][C]-0.152458364992565[/C][/ROW]
[ROW][C]11[/C][C]0.0426153145357136[/C][/ROW]
[ROW][C]12[/C][C]-0.240102000796936[/C][/ROW]
[ROW][C]13[/C][C]-0.119821913133199[/C][/ROW]
[ROW][C]14[/C][C]-0.00699296605064719[/C][/ROW]
[/TABLE]
Source: https://freestatistics.org/blog/index.php?pk=&T=1

Globally Unique Identifier (entire table): ba.freestatistics.org/blog/index.php?pk=&T=1

As an alternative you can also use a QR Code:  

The GUIDs for individual cells are displayed in the table below:

Cross Correlation Function
ParameterValue
Box-Cox transformation parameter (lambda) of X series1
Degree of non-seasonal differencing (d) of X series0
Degree of seasonal differencing (D) of X series0
Seasonal Period (s)1
Box-Cox transformation parameter (lambda) of Y series1
Degree of non-seasonal differencing (d) of Y series0
Degree of seasonal differencing (D) of Y series0
krho(Y[t],X[t+k])
-140.124136035054624
-130.0794594846661588
-120.0961387548735791
-11-0.0304360463516121
-100.0108362741441395
-9-0.205122745258631
-8-0.0833363143744791
-70.00704352324022379
-6-0.0299059514712282
-5-0.139314732155657
-4-0.13403631427326
-3-0.209061260233581
-2-0.0775929901618447
-10.0871535882630129
00.057908864382633
10.0604664674254391
20.0427772211876593
3-0.054203626874805
4-0.0910725947572029
50.121705580595929
60.0663105625580584
7-0.116904914416664
8-0.126465237750497
9-0.124110344308833
10-0.152458364992565
110.0426153145357136
12-0.240102000796936
13-0.119821913133199
14-0.00699296605064719


Parameters (Session):
par1 = 1 ; par2 = 0 ; par3 = 0 ; par4 = 1 ; par5 = 1 ; par6 = 0 ; par7 = 0 ; par8 = na.fail ;
Parameters (R input):
par1 = 1 ; par2 = 0 ; par3 = 0 ; par4 = 1 ; par5 = 1 ; par6 = 0 ; par7 = 0 ; par8 = na.fail ;
R code (references can be found in the software module):
par8 <- 'na.fail'
par7 <- '0'
par6 <- '0'
par5 <- '1'
par4 <- '1'
par3 <- '0'
par2 <- '0'
par1 <- '1'
par1 <- as.numeric(par1)
par2 <- as.numeric(par2)
par3 <- as.numeric(par3)
par4 <- as.numeric(par4)
par5 <- as.numeric(par5)
par6 <- as.numeric(par6)
par7 <- as.numeric(par7)
if (par8=='na.fail') par8 <- na.fail else par8 <- na.pass
ccf <- function (x, y, lag.max = NULL, type = c('correlation', 'covariance'), plot = TRUE, na.action = na.fail, ...) {
type <- match.arg(type)
if (is.matrix(x) || is.matrix(y))
stop('univariate time series only')
X <- na.action(ts.intersect(as.ts(x), as.ts(y)))
colnames(X) <- c(deparse(substitute(x))[1L], deparse(substitute(y))[1L])
acf.out <- acf(X, lag.max = lag.max, plot = FALSE, type = type, na.action=na.action)
lag <- c(rev(acf.out$lag[-1, 2, 1]), acf.out$lag[, 1, 2])
y <- c(rev(acf.out$acf[-1, 2, 1]), acf.out$acf[, 1, 2])
acf.out$acf <- array(y, dim = c(length(y), 1L, 1L))
acf.out$lag <- array(lag, dim = c(length(y), 1L, 1L))
acf.out$snames <- paste(acf.out$snames, collapse = ' & ')
if (plot) {
plot(acf.out, ...)
return(invisible(acf.out))
}
else return(acf.out)
}
if (par1 == 0) {
x <- log(x)
} else {
x <- (x ^ par1 - 1) / par1
}
if (par5 == 0) {
y <- log(y)
} else {
y <- (y ^ par5 - 1) / par5
}
if (par2 > 0) x <- diff(x,lag=1,difference=par2)
if (par6 > 0) y <- diff(y,lag=1,difference=par6)
if (par3 > 0) x <- diff(x,lag=par4,difference=par3)
if (par7 > 0) y <- diff(y,lag=par4,difference=par7)
print(x)
print(y)
bitmap(file='test1.png')
(r <- ccf(x,y,na.action=par8,main='Cross Correlation Function',ylab='CCF',xlab='Lag (k)'))
dev.off()
load(file='createtable')
a<-table.start()
a<-table.row.start(a)
a<-table.element(a,'Cross Correlation Function',2,TRUE)
a<-table.row.end(a)
a<-table.row.start(a)
a<-table.element(a,'Parameter',header=TRUE)
a<-table.element(a,'Value',header=TRUE)
a<-table.row.end(a)
a<-table.row.start(a)
a<-table.element(a,'Box-Cox transformation parameter (lambda) of X series',header=TRUE)
a<-table.element(a,par1)
a<-table.row.end(a)
a<-table.row.start(a)
a<-table.element(a,'Degree of non-seasonal differencing (d) of X series',header=TRUE)
a<-table.element(a,par2)
a<-table.row.end(a)
a<-table.row.start(a)
a<-table.element(a,'Degree of seasonal differencing (D) of X series',header=TRUE)
a<-table.element(a,par3)
a<-table.row.end(a)
a<-table.row.start(a)
a<-table.element(a,'Seasonal Period (s)',header=TRUE)
a<-table.element(a,par4)
a<-table.row.end(a)
a<-table.row.start(a)
a<-table.element(a,'Box-Cox transformation parameter (lambda) of Y series',header=TRUE)
a<-table.element(a,par5)
a<-table.row.end(a)
a<-table.row.start(a)
a<-table.element(a,'Degree of non-seasonal differencing (d) of Y series',header=TRUE)
a<-table.element(a,par6)
a<-table.row.end(a)
a<-table.row.start(a)
a<-table.element(a,'Degree of seasonal differencing (D) of Y series',header=TRUE)
a<-table.element(a,par7)
a<-table.row.end(a)
a<-table.row.start(a)
a<-table.element(a,'k',header=TRUE)
a<-table.element(a,'rho(Y[t],X[t+k])',header=TRUE)
a<-table.row.end(a)
mylength <- length(r$acf)
myhalf <- floor((mylength-1)/2)
for (i in 1:mylength) {
a<-table.row.start(a)
a<-table.element(a,i-myhalf-1,header=TRUE)
a<-table.element(a,r$acf[i])
a<-table.row.end(a)
}
a<-table.end(a)
table.save(a,file='mytable.tab')