Free Statistics

of Irreproducible Research!

Author's title

Author*Unverified author*
R Software Modulerwasp_cross.wasp
Title produced by softwareCross Correlation Function
Date of computationThu, 18 Jul 2019 00:04:51 +0200
Cite this page as followsStatistical Computations at FreeStatistics.org, Office for Research Development and Education, URL https://freestatistics.org/blog/index.php?v=date/2019/Jul/18/t15634011578fv3942xajyu1nn.htm/, Retrieved Fri, 19 Apr 2024 17:53:15 +0200
Statistical Computations at FreeStatistics.org, Office for Research Development and Education, URL https://freestatistics.org/blog/index.php?pk=, Retrieved Fri, 19 Apr 2024 17:53:15 +0200
QR Codes:

Original text written by user:
IsPrivate?This computation is private
User-defined keywords
Estimated Impact0
Dataseries X:
1107
1454
1236
1240
1518
1852
1158
1345
2404
1361
1646
1745
Dataseries Y:
210
160
138
180
150
140
161
137
160
144
158
128


Summary of computational transaction
Raw Input view raw input (R code)
Raw Outputview raw output of R engine
Computing time1 seconds
R ServerBig Analytics Cloud Computing Center

\begin{tabular}{lllllllll}
\hline
Summary of computational transaction \tabularnewline
Raw Input view raw input (R code)  \tabularnewline
Raw Outputview raw output of R engine  \tabularnewline
Computing time1 seconds \tabularnewline
R ServerBig Analytics Cloud Computing Center \tabularnewline
\hline
\end{tabular}
%Source: https://freestatistics.org/blog/index.php?pk=&T=0

[TABLE]
[ROW]
Summary of computational transaction[/C][/ROW] [ROW]Raw Input[/C] view raw input (R code) [/C][/ROW] [ROW]Raw Output[/C]view raw output of R engine [/C][/ROW] [ROW]Computing time[/C]1 seconds[/C][/ROW] [ROW]R Server[/C]Big Analytics Cloud Computing Center[/C][/ROW] [/TABLE] Source: https://freestatistics.org/blog/index.php?pk=&T=0

Globally Unique Identifier (entire table): ba.freestatistics.org/blog/index.php?pk=&T=0

As an alternative you can also use a QR Code:  

The GUIDs for individual cells are displayed in the table below:

Summary of computational transaction
Raw Input view raw input (R code)
Raw Outputview raw output of R engine
Computing time1 seconds
R ServerBig Analytics Cloud Computing Center


Cross Correlation Function
ParameterValue
Box-Cox transformation parameter (lambda) of X series1
Degree of non-seasonal differencing (d) of X series0
Degree of seasonal differencing (D) of X series0
Seasonal Period (s)1
Box-Cox transformation parameter (lambda) of Y series1
Degree of non-seasonal differencing (d) of Y series0
Degree of seasonal differencing (D) of Y series0
krho(Y[t],X[t+k])
-70.102867876818208
-6-0.0991213011102147
-50.222435174728922
-40.0672545159061663
-3-0.29581234744265
-20.127801407793858
-1-0.146784986567074
0-0.319224963669925
1-0.164445425220367
20.025404290302528
3-0.494171943105262
4-0.0219557693162857
50.468828935081972
6-0.483684316681027
7-0.000559897187588611

\begin{tabular}{lllllllll}
\hline
Cross Correlation Function \tabularnewline
Parameter & Value \tabularnewline
Box-Cox transformation parameter (lambda) of X series & 1 \tabularnewline
Degree of non-seasonal differencing (d) of X series & 0 \tabularnewline
Degree of seasonal differencing (D) of X series & 0 \tabularnewline
Seasonal Period (s) & 1 \tabularnewline
Box-Cox transformation parameter (lambda) of Y series & 1 \tabularnewline
Degree of non-seasonal differencing (d) of Y series & 0 \tabularnewline
Degree of seasonal differencing (D) of Y series & 0 \tabularnewline
k & rho(Y[t],X[t+k]) \tabularnewline
-7 & 0.102867876818208 \tabularnewline
-6 & -0.0991213011102147 \tabularnewline
-5 & 0.222435174728922 \tabularnewline
-4 & 0.0672545159061663 \tabularnewline
-3 & -0.29581234744265 \tabularnewline
-2 & 0.127801407793858 \tabularnewline
-1 & -0.146784986567074 \tabularnewline
0 & -0.319224963669925 \tabularnewline
1 & -0.164445425220367 \tabularnewline
2 & 0.025404290302528 \tabularnewline
3 & -0.494171943105262 \tabularnewline
4 & -0.0219557693162857 \tabularnewline
5 & 0.468828935081972 \tabularnewline
6 & -0.483684316681027 \tabularnewline
7 & -0.000559897187588611 \tabularnewline
\hline
\end{tabular}
%Source: https://freestatistics.org/blog/index.php?pk=&T=1

[TABLE]
[ROW][C]Cross Correlation Function[/C][/ROW]
[ROW][C]Parameter[/C][C]Value[/C][/ROW]
[ROW][C]Box-Cox transformation parameter (lambda) of X series[/C][C]1[/C][/ROW]
[ROW][C]Degree of non-seasonal differencing (d) of X series[/C][C]0[/C][/ROW]
[ROW][C]Degree of seasonal differencing (D) of X series[/C][C]0[/C][/ROW]
[ROW][C]Seasonal Period (s)[/C][C]1[/C][/ROW]
[ROW][C]Box-Cox transformation parameter (lambda) of Y series[/C][C]1[/C][/ROW]
[ROW][C]Degree of non-seasonal differencing (d) of Y series[/C][C]0[/C][/ROW]
[ROW][C]Degree of seasonal differencing (D) of Y series[/C][C]0[/C][/ROW]
[ROW][C]k[/C][C]rho(Y[t],X[t+k])[/C][/ROW]
[ROW][C]-7[/C][C]0.102867876818208[/C][/ROW]
[ROW][C]-6[/C][C]-0.0991213011102147[/C][/ROW]
[ROW][C]-5[/C][C]0.222435174728922[/C][/ROW]
[ROW][C]-4[/C][C]0.0672545159061663[/C][/ROW]
[ROW][C]-3[/C][C]-0.29581234744265[/C][/ROW]
[ROW][C]-2[/C][C]0.127801407793858[/C][/ROW]
[ROW][C]-1[/C][C]-0.146784986567074[/C][/ROW]
[ROW][C]0[/C][C]-0.319224963669925[/C][/ROW]
[ROW][C]1[/C][C]-0.164445425220367[/C][/ROW]
[ROW][C]2[/C][C]0.025404290302528[/C][/ROW]
[ROW][C]3[/C][C]-0.494171943105262[/C][/ROW]
[ROW][C]4[/C][C]-0.0219557693162857[/C][/ROW]
[ROW][C]5[/C][C]0.468828935081972[/C][/ROW]
[ROW][C]6[/C][C]-0.483684316681027[/C][/ROW]
[ROW][C]7[/C][C]-0.000559897187588611[/C][/ROW]
[/TABLE]
Source: https://freestatistics.org/blog/index.php?pk=&T=1

Globally Unique Identifier (entire table): ba.freestatistics.org/blog/index.php?pk=&T=1

As an alternative you can also use a QR Code:  

The GUIDs for individual cells are displayed in the table below:

Cross Correlation Function
ParameterValue
Box-Cox transformation parameter (lambda) of X series1
Degree of non-seasonal differencing (d) of X series0
Degree of seasonal differencing (D) of X series0
Seasonal Period (s)1
Box-Cox transformation parameter (lambda) of Y series1
Degree of non-seasonal differencing (d) of Y series0
Degree of seasonal differencing (D) of Y series0
krho(Y[t],X[t+k])
-70.102867876818208
-6-0.0991213011102147
-50.222435174728922
-40.0672545159061663
-3-0.29581234744265
-20.127801407793858
-1-0.146784986567074
0-0.319224963669925
1-0.164445425220367
20.025404290302528
3-0.494171943105262
4-0.0219557693162857
50.468828935081972
6-0.483684316681027
7-0.000559897187588611


Parameters (Session):
par1 = 1 ; par2 = 0 ; par3 = 0 ; par4 = 1 ; par5 = 1 ; par6 = 0 ; par7 = 0 ; par8 = na.fail ;
Parameters (R input):
par1 = 1 ; par2 = 0 ; par3 = 0 ; par4 = 1 ; par5 = 1 ; par6 = 0 ; par7 = 0 ; par8 = na.fail ;
R code (references can be found in the software module):
par8 <- 'na.fail'
par7 <- '0'
par6 <- '0'
par5 <- '1'
par4 <- '1'
par3 <- '0'
par2 <- '0'
par1 <- '1'
par1 <- as.numeric(par1)
par2 <- as.numeric(par2)
par3 <- as.numeric(par3)
par4 <- as.numeric(par4)
par5 <- as.numeric(par5)
par6 <- as.numeric(par6)
par7 <- as.numeric(par7)
if (par8=='na.fail') par8 <- na.fail else par8 <- na.pass
ccf <- function (x, y, lag.max = NULL, type = c('correlation', 'covariance'), plot = TRUE, na.action = na.fail, ...) {
type <- match.arg(type)
if (is.matrix(x) || is.matrix(y))
stop('univariate time series only')
X <- na.action(ts.intersect(as.ts(x), as.ts(y)))
colnames(X) <- c(deparse(substitute(x))[1L], deparse(substitute(y))[1L])
acf.out <- acf(X, lag.max = lag.max, plot = FALSE, type = type, na.action=na.action)
lag <- c(rev(acf.out$lag[-1, 2, 1]), acf.out$lag[, 1, 2])
y <- c(rev(acf.out$acf[-1, 2, 1]), acf.out$acf[, 1, 2])
acf.out$acf <- array(y, dim = c(length(y), 1L, 1L))
acf.out$lag <- array(lag, dim = c(length(y), 1L, 1L))
acf.out$snames <- paste(acf.out$snames, collapse = ' & ')
if (plot) {
plot(acf.out, ...)
return(invisible(acf.out))
}
else return(acf.out)
}
if (par1 == 0) {
x <- log(x)
} else {
x <- (x ^ par1 - 1) / par1
}
if (par5 == 0) {
y <- log(y)
} else {
y <- (y ^ par5 - 1) / par5
}
if (par2 > 0) x <- diff(x,lag=1,difference=par2)
if (par6 > 0) y <- diff(y,lag=1,difference=par6)
if (par3 > 0) x <- diff(x,lag=par4,difference=par3)
if (par7 > 0) y <- diff(y,lag=par4,difference=par7)
print(x)
print(y)
bitmap(file='test1.png')
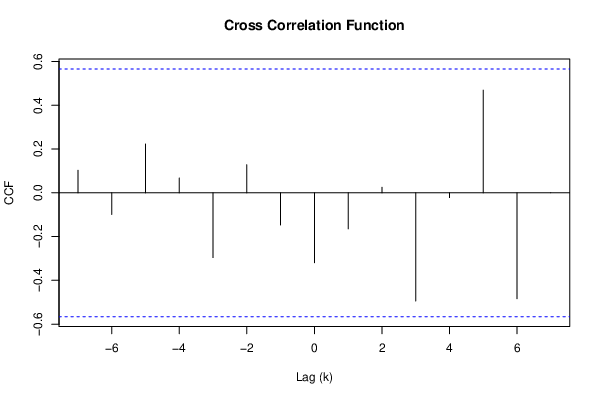
(r <- ccf(x,y,na.action=par8,main='Cross Correlation Function',ylab='CCF',xlab='Lag (k)'))
dev.off()
load(file='createtable')
a<-table.start()
a<-table.row.start(a)
a<-table.element(a,'Cross Correlation Function',2,TRUE)
a<-table.row.end(a)
a<-table.row.start(a)
a<-table.element(a,'Parameter',header=TRUE)
a<-table.element(a,'Value',header=TRUE)
a<-table.row.end(a)
a<-table.row.start(a)
a<-table.element(a,'Box-Cox transformation parameter (lambda) of X series',header=TRUE)
a<-table.element(a,par1)
a<-table.row.end(a)
a<-table.row.start(a)
a<-table.element(a,'Degree of non-seasonal differencing (d) of X series',header=TRUE)
a<-table.element(a,par2)
a<-table.row.end(a)
a<-table.row.start(a)
a<-table.element(a,'Degree of seasonal differencing (D) of X series',header=TRUE)
a<-table.element(a,par3)
a<-table.row.end(a)
a<-table.row.start(a)
a<-table.element(a,'Seasonal Period (s)',header=TRUE)
a<-table.element(a,par4)
a<-table.row.end(a)
a<-table.row.start(a)
a<-table.element(a,'Box-Cox transformation parameter (lambda) of Y series',header=TRUE)
a<-table.element(a,par5)
a<-table.row.end(a)
a<-table.row.start(a)
a<-table.element(a,'Degree of non-seasonal differencing (d) of Y series',header=TRUE)
a<-table.element(a,par6)
a<-table.row.end(a)
a<-table.row.start(a)
a<-table.element(a,'Degree of seasonal differencing (D) of Y series',header=TRUE)
a<-table.element(a,par7)
a<-table.row.end(a)
a<-table.row.start(a)
a<-table.element(a,'k',header=TRUE)
a<-table.element(a,'rho(Y[t],X[t+k])',header=TRUE)
a<-table.row.end(a)
mylength <- length(r$acf)
myhalf <- floor((mylength-1)/2)
for (i in 1:mylength) {
a<-table.row.start(a)
a<-table.element(a,i-myhalf-1,header=TRUE)
a<-table.element(a,r$acf[i])
a<-table.row.end(a)
}
a<-table.end(a)
table.save(a,file='mytable.tab')