| Multiple Linear Regression - Estimated Regression Equation |
| YY[t] = + 67.7757 + 7.70333X1[t] -11.1058X2[t] + 6.25483X3[t] + e[t] |
| Multiple Linear Regression - Ordinary Least Squares | |||||
| Variable | Parameter | S.D. | T-STAT H0: parameter = 0 | 2-tail p-value | 1-tail p-value |
| (Intercept) | +67.78 | 27.09 | +2.5020e+00 | 0.04088 | 0.02044 |
| X1 | +7.703 | 2.082 | +3.7010e+00 | 0.007649 | 0.003824 |
| X2 | -11.11 | 4.036 | -2.7520e+00 | 0.02844 | 0.01422 |
| X3 | +6.255 | 1.997 | +3.1320e+00 | 0.01657 | 0.008287 |
| Multiple Linear Regression - Regression Statistics | |
| Multiple R | 0.8294 |
| R-squared | 0.688 |
| Adjusted R-squared | 0.5542 |
| F-TEST (value) | 5.144 |
| F-TEST (DF numerator) | 3 |
| F-TEST (DF denominator) | 7 |
| p-value | 0.03436 |
| Multiple Linear Regression - Residual Statistics | |
| Residual Standard Deviation | 19.19 |
| Sum Squared Residuals | 2578 |
| Menu of Residual Diagnostics | |
| Description | Link |
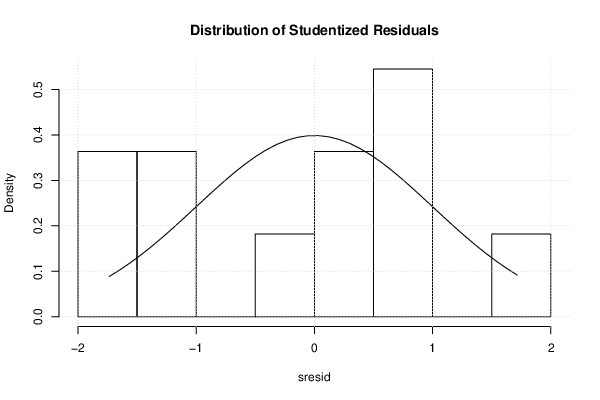
| Histogram | Compute |
| Central Tendency | Compute |
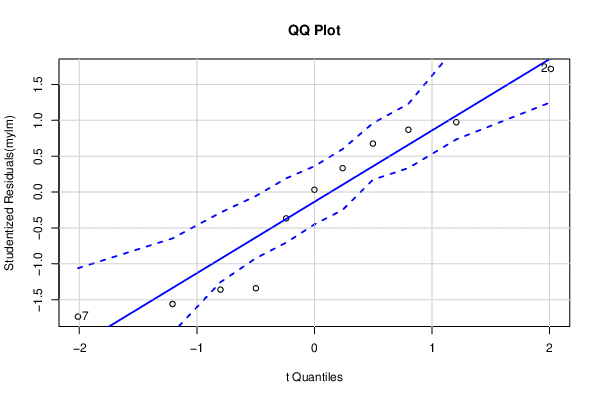
| QQ Plot | Compute |
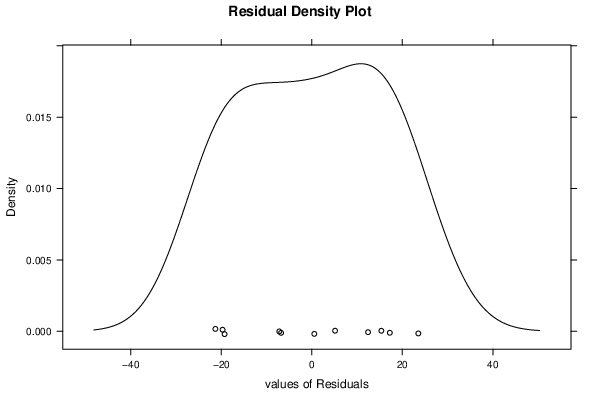
| Kernel Density Plot | Compute |
| Skewness/Kurtosis Test | Compute |
| Skewness-Kurtosis Plot | Compute |
| Harrell-Davis Plot | Compute |
| Bootstrap Plot -- Central Tendency | Compute |
| Blocked Bootstrap Plot -- Central Tendency | Compute |
| (Partial) Autocorrelation Plot | Compute |
| Spectral Analysis | Compute |
| Tukey lambda PPCC Plot | Compute |
| Box-Cox Normality Plot | Compute |
| Summary Statistics | Compute |
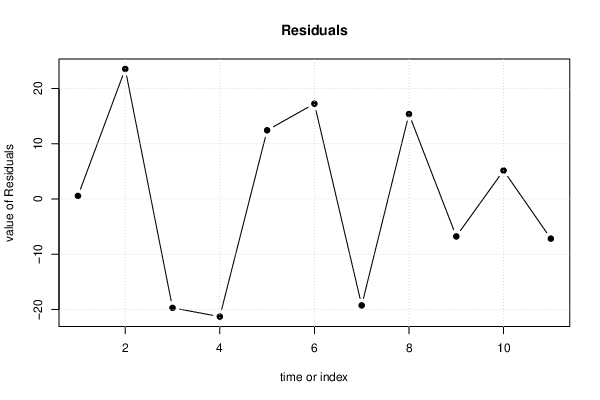
| Multiple Linear Regression - Actuals, Interpolation, and Residuals | |||
| Time or Index | Actuals | Interpolation Forecast | Residuals Prediction Error |
| 1 | 94 | 93.45 | 0.5527 |
| 2 | 65 | 41.48 | 23.52 |
| 3 | 16 | 35.71 | -19.71 |
| 4 | 75 | 96.3 | -21.3 |
| 5 | 76 | 63.58 | 12.42 |
| 6 | 64 | 46.77 | 17.23 |
| 7 | 0 | 19.27 | -19.27 |
| 8 | 90 | 74.64 | 15.36 |
| 9 | 51 | 57.78 | -6.783 |
| 10 | 50 | 44.86 | 5.143 |
| 11 | 60 | 67.18 | -7.181 |
| Ramsey RESET F-Test for powers (2 and 3) of fitted values |
> reset_test_fitted RESET test data: mylm RESET = 2.1554, df1 = 2, df2 = 5, p-value = 0.2113 |
| Ramsey RESET F-Test for powers (2 and 3) of regressors |
> reset_test_regressors RESET test data: mylm RESET = 1.1201, df1 = 6, df2 = 1, p-value = 0.6188 |
| Ramsey RESET F-Test for powers (2 and 3) of principal components |
> reset_test_principal_components RESET test data: mylm RESET = 0.088001, df1 = 2, df2 = 5, p-value = 0.9171 |
| Variance Inflation Factors (Multicollinearity) |
> vif
      X1       X2       X3
1.846086 1.841739 1.587416
|