| Multiple Linear Regression - Estimated Regression Equation |
| ^QP[t] = + 2.70262 + 2.48764`^M`[t] + 0.856761`^M-1`[t] + 1.46887`^M-2`[t] + 0.600318`^M-3`[t] + 0.70018`^Gf`[t] + 0.160499`^Gf-1`[t] -0.472344`^Gf-2`[t] -0.650205`^Gf-3`[t] + e[t] |
| Multiple Linear Regression - Ordinary Least Squares | |||||
| Variable | Parameter | S.D. | T-STAT H0: parameter = 0 | 2-tail p-value | 1-tail p-value |
| (Intercept) | +2.703 | 0.6306 | +4.2860e+00 | 4.689e-05 | 2.344e-05 |
| `^M` | +2.488 | 0.5122 | +4.8560e+00 | 5.226e-06 | 2.613e-06 |
| `^M-1` | +0.8568 | 0.6882 | +1.2450e+00 | 0.2165 | 0.1082 |
| `^M-2` | +1.469 | 0.6918 | +2.1230e+00 | 0.03657 | 0.01828 |
| `^M-3` | +0.6003 | 0.5432 | +1.1050e+00 | 0.2722 | 0.1361 |
| `^Gf` | +0.7002 | 0.2448 | +2.8600e+00 | 0.0053 | 0.00265 |
| `^Gf-1` | +0.1605 | 0.2663 | +6.0270e-01 | 0.5483 | 0.2741 |
| `^Gf-2` | -0.4723 | 0.2685 | -1.7590e+00 | 0.08201 | 0.04101 |
| `^Gf-3` | -0.6502 | 0.2441 | -2.6630e+00 | 0.009219 | 0.00461 |
| Multiple Linear Regression - Regression Statistics | |
| Multiple R | 0.8504 |
| R-squared | 0.7232 |
| Adjusted R-squared | 0.6977 |
| F-TEST (value) | 28.41 |
| F-TEST (DF numerator) | 8 |
| F-TEST (DF denominator) | 87 |
| p-value | 0 |
| Multiple Linear Regression - Residual Statistics | |
| Residual Standard Deviation | 3.792 |
| Sum Squared Residuals | 1251 |
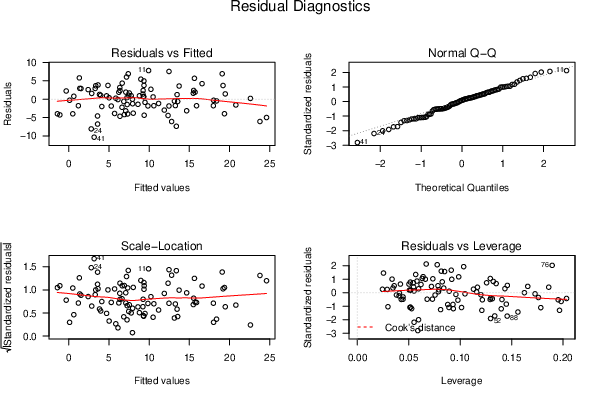
| Menu of Residual Diagnostics | |
| Description | Link |
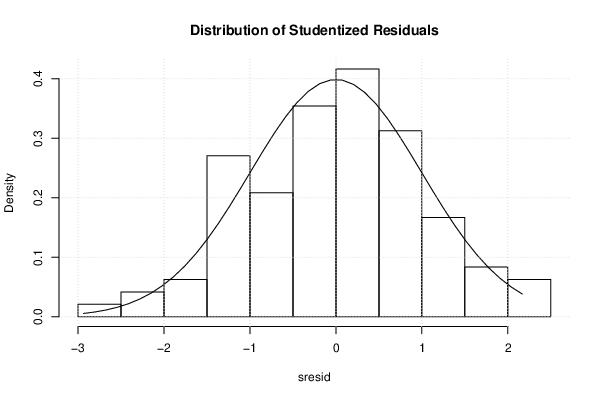
| Histogram | Compute |
| Central Tendency | Compute |
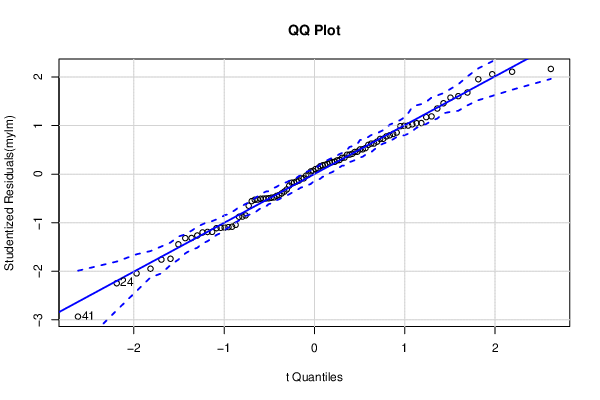
| QQ Plot | Compute |
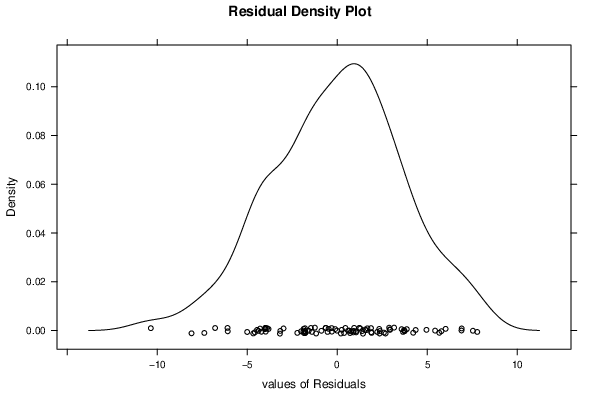
| Kernel Density Plot | Compute |
| Skewness/Kurtosis Test | Compute |
| Skewness-Kurtosis Plot | Compute |
| Harrell-Davis Plot | Compute |
| Bootstrap Plot -- Central Tendency | Compute |
| Blocked Bootstrap Plot -- Central Tendency | Compute |
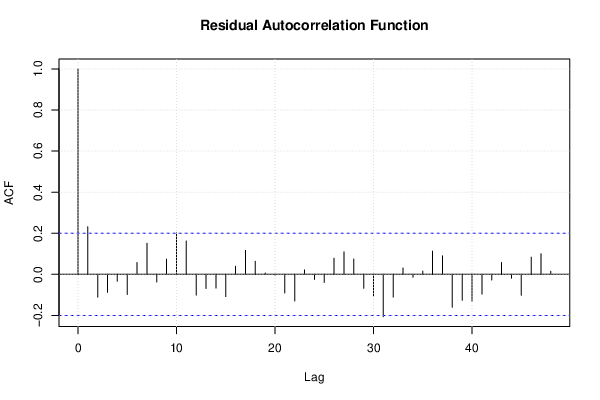
| (Partial) Autocorrelation Plot | Compute |
| Spectral Analysis | Compute |
| Tukey lambda PPCC Plot | Compute |
| Box-Cox Normality Plot | Compute |
| Summary Statistics | Compute |
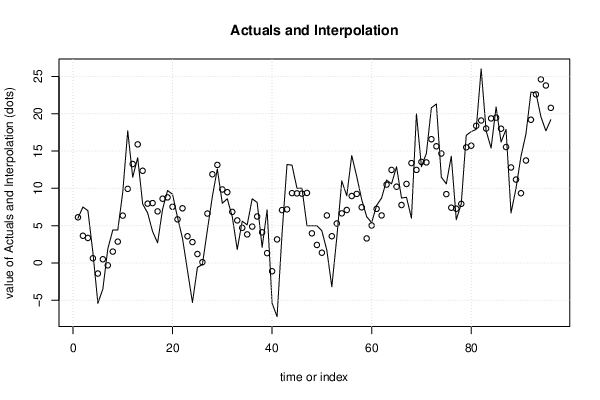
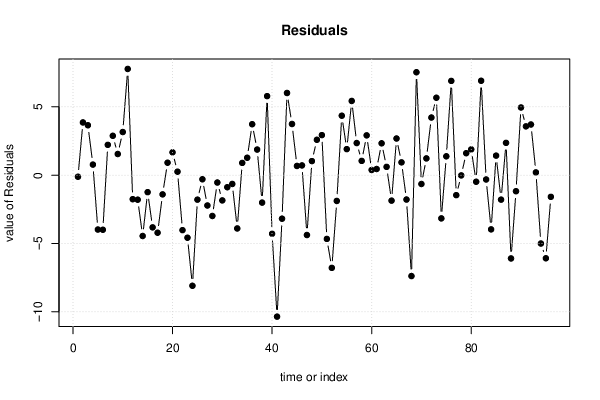
| Multiple Linear Regression - Actuals, Interpolation, and Residuals | |||
| Time or Index | Actuals | Interpolation Forecast | Residuals Prediction Error |
| 1 | 6 | 6.116 | -0.1156 |
| 2 | 7.5 | 3.64 | 3.86 |
| 3 | 7 | 3.347 | 3.653 |
| 4 | 1.4 | 0.6247 | 0.7753 |
| 5 | -5.4 | -1.421 | -3.979 |
| 6 | -3.5 | 0.4946 | -3.995 |
| 7 | 1.9 | -0.32 | 2.22 |
| 8 | 4.4 | 1.518 | 2.882 |
| 9 | 4.4 | 2.851 | 1.549 |
| 10 | 9.5 | 6.343 | 3.157 |
| 11 | 17.7 | 9.926 | 7.774 |
| 12 | 11.5 | 13.26 | -1.758 |
| 13 | 14.1 | 15.89 | -1.794 |
| 14 | 7.9 | 12.35 | -4.452 |
| 15 | 6.7 | 7.944 | -1.244 |
| 16 | 4.2 | 8.02 | -3.82 |
| 17 | 2.7 | 6.911 | -4.211 |
| 18 | 7.2 | 8.606 | -1.406 |
| 19 | 9.7 | 8.787 | 0.9133 |
| 20 | 9.2 | 7.528 | 1.672 |
| 21 | 6.1 | 5.846 | 0.2541 |
| 22 | 3.3 | 7.323 | -4.023 |
| 23 | -1 | 3.577 | -4.577 |
| 24 | -5.3 | 2.794 | -8.094 |
| 25 | -0.6 | 1.192 | -1.792 |
| 26 | -0.2 | 0.1006 | -0.3006 |
| 27 | 4.4 | 6.619 | -2.219 |
| 28 | 8.9 | 11.89 | -2.986 |
| 29 | 12.6 | 13.14 | -0.5381 |
| 30 | 8 | 9.847 | -1.847 |
| 31 | 8.6 | 9.481 | -0.8814 |
| 32 | 6.2 | 6.842 | -0.6417 |
| 33 | 1.8 | 5.699 | -3.899 |
| 34 | 5.6 | 4.702 | 0.8977 |
| 35 | 5.1 | 3.824 | 1.276 |
| 36 | 8.6 | 4.871 | 3.729 |
| 37 | 8.1 | 6.225 | 1.875 |
| 38 | 2.1 | 4.108 | -2.008 |
| 39 | 7.1 | 1.315 | 5.785 |
| 40 | -5.4 | -1.113 | -4.287 |
| 41 | -7.2 | 3.154 | -10.35 |
| 42 | 3.9 | 7.084 | -3.184 |
| 43 | 13.2 | 7.184 | 6.016 |
| 44 | 13.1 | 9.354 | 3.746 |
| 45 | 10 | 9.324 | 0.6761 |
| 46 | 10 | 9.287 | 0.7131 |
| 47 | 5 | 9.379 | -4.379 |
| 48 | 5 | 3.968 | 1.032 |
| 49 | 5 | 2.411 | 2.589 |
| 50 | 4.3 | 1.368 | 2.932 |
| 51 | 1.7 | 6.365 | -4.665 |
| 52 | -3.2 | 3.584 | -6.784 |
| 53 | 3.4 | 5.285 | -1.885 |
| 54 | 11 | 6.647 | 4.353 |
| 55 | 9 | 7.094 | 1.906 |
| 56 | 14.4 | 8.967 | 5.433 |
| 57 | 11.6 | 9.249 | 2.351 |
| 58 | 8.5 | 7.454 | 1.046 |
| 59 | 6.2 | 3.286 | 2.914 |
| 60 | 5.4 | 5.02 | 0.3796 |
| 61 | 7.7 | 7.248 | 0.4517 |
| 62 | 8.7 | 6.368 | 2.332 |
| 63 | 11.1 | 10.49 | 0.6089 |
| 64 | 10.6 | 12.46 | -1.865 |
| 65 | 12.9 | 10.22 | 2.682 |
| 66 | 8.7 | 7.762 | 0.9375 |
| 67 | 8.8 | 10.58 | -1.784 |
| 68 | 6 | 13.38 | -7.384 |
| 69 | 20 | 12.47 | 7.534 |
| 70 | 12.9 | 13.54 | -0.6449 |
| 71 | 14.7 | 13.47 | 1.227 |
| 72 | 20.8 | 16.58 | 4.217 |
| 73 | 21.3 | 15.63 | 5.668 |
| 74 | 11.5 | 14.66 | -3.163 |
| 75 | 10.6 | 9.22 | 1.38 |
| 76 | 14.3 | 7.4 | 6.9 |
| 77 | 5.8 | 7.263 | -1.463 |
| 78 | 7.9 | 7.918 | -0.01776 |
| 79 | 17.1 | 15.49 | 1.607 |
| 80 | 17.6 | 15.71 | 1.887 |
| 81 | 17.9 | 18.38 | -0.4803 |
| 82 | 26 | 19.09 | 6.91 |
| 83 | 17.7 | 18.02 | -0.3151 |
| 84 | 15.4 | 19.37 | -3.968 |
| 85 | 20.9 | 19.47 | 1.43 |
| 86 | 16.2 | 17.99 | -1.79 |
| 87 | 17.9 | 15.53 | 2.365 |
| 88 | 6.7 | 12.8 | -6.095 |
| 89 | 10 | 11.17 | -1.174 |
| 90 | 14.3 | 9.346 | 4.954 |
| 91 | 17.3 | 13.73 | 3.572 |
| 92 | 22.9 | 19.19 | 3.709 |
| 93 | 22.8 | 22.6 | 0.2021 |
| 94 | 19.6 | 24.6 | -5.003 |
| 95 | 17.7 | 23.78 | -6.082 |
| 96 | 19.2 | 20.79 | -1.585 |
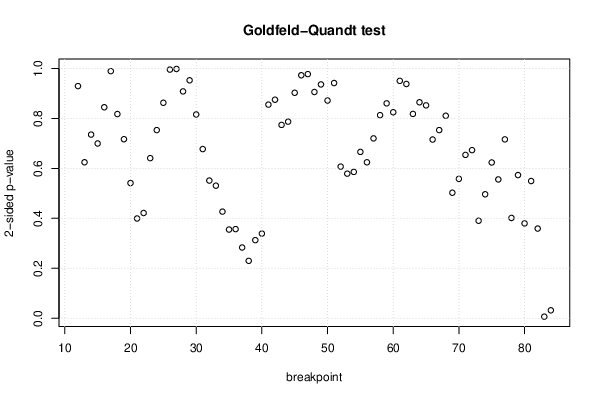
| Goldfeld-Quandt test for Heteroskedasticity | |||
| p-values | Alternative Hypothesis | ||
| breakpoint index | greater | 2-sided | less |
| 12 | 0.4649 | 0.9297 | 0.5351 |
| 13 | 0.3123 | 0.6245 | 0.6877 |
| 14 | 0.3677 | 0.7354 | 0.6323 |
| 15 | 0.6501 | 0.6999 | 0.3499 |
| 16 | 0.5775 | 0.8449 | 0.4225 |
| 17 | 0.5052 | 0.9896 | 0.4948 |
| 18 | 0.4088 | 0.8177 | 0.5912 |
| 19 | 0.3585 | 0.717 | 0.6415 |
| 20 | 0.2706 | 0.5413 | 0.7294 |
| 21 | 0.1997 | 0.3993 | 0.8003 |
| 22 | 0.2107 | 0.4214 | 0.7893 |
| 23 | 0.3205 | 0.6411 | 0.6795 |
| 24 | 0.6233 | 0.7535 | 0.3767 |
| 25 | 0.5686 | 0.8628 | 0.4314 |
| 26 | 0.5021 | 0.9958 | 0.4979 |
| 27 | 0.4992 | 0.9984 | 0.5008 |
| 28 | 0.5458 | 0.9084 | 0.4542 |
| 29 | 0.4764 | 0.9529 | 0.5236 |
| 30 | 0.408 | 0.816 | 0.592 |
| 31 | 0.3387 | 0.6775 | 0.6613 |
| 32 | 0.2756 | 0.5513 | 0.7244 |
| 33 | 0.2654 | 0.5308 | 0.7346 |
| 34 | 0.2134 | 0.4269 | 0.7866 |
| 35 | 0.1775 | 0.355 | 0.8225 |
| 36 | 0.1784 | 0.3569 | 0.8216 |
| 37 | 0.1416 | 0.2831 | 0.8584 |
| 38 | 0.1149 | 0.2297 | 0.8851 |
| 39 | 0.1563 | 0.3127 | 0.8437 |
| 40 | 0.1694 | 0.3389 | 0.8306 |
| 41 | 0.5723 | 0.8554 | 0.4277 |
| 42 | 0.5625 | 0.875 | 0.4375 |
| 43 | 0.6129 | 0.7742 | 0.3871 |
| 44 | 0.6064 | 0.7872 | 0.3936 |
| 45 | 0.5486 | 0.9028 | 0.4514 |
| 46 | 0.4866 | 0.9731 | 0.5134 |
| 47 | 0.5111 | 0.9778 | 0.4889 |
| 48 | 0.453 | 0.9061 | 0.547 |
| 49 | 0.4682 | 0.9363 | 0.5318 |
| 50 | 0.4359 | 0.8718 | 0.5641 |
| 51 | 0.529 | 0.9419 | 0.471 |
| 52 | 0.6964 | 0.6072 | 0.3036 |
| 53 | 0.7105 | 0.5789 | 0.2895 |
| 54 | 0.707 | 0.5859 | 0.293 |
| 55 | 0.667 | 0.6661 | 0.333 |
| 56 | 0.6878 | 0.6245 | 0.3122 |
| 57 | 0.6399 | 0.7203 | 0.3601 |
| 58 | 0.5933 | 0.8133 | 0.4067 |
| 59 | 0.5697 | 0.8606 | 0.4303 |
| 60 | 0.5876 | 0.8249 | 0.4124 |
| 61 | 0.5246 | 0.9508 | 0.4754 |
| 62 | 0.4691 | 0.9382 | 0.5309 |
| 63 | 0.4091 | 0.8182 | 0.5909 |
| 64 | 0.4324 | 0.8648 | 0.5676 |
| 65 | 0.4263 | 0.8525 | 0.5737 |
| 66 | 0.3578 | 0.7156 | 0.6422 |
| 67 | 0.3767 | 0.7535 | 0.6233 |
| 68 | 0.5946 | 0.8108 | 0.4054 |
| 69 | 0.7488 | 0.5025 | 0.2512 |
| 70 | 0.721 | 0.5581 | 0.279 |
| 71 | 0.6729 | 0.6542 | 0.3271 |
| 72 | 0.6634 | 0.6731 | 0.3366 |
| 73 | 0.8049 | 0.3903 | 0.1951 |
| 74 | 0.7519 | 0.4963 | 0.2481 |
| 75 | 0.6881 | 0.6237 | 0.3119 |
| 76 | 0.7221 | 0.5558 | 0.2779 |
| 77 | 0.6419 | 0.7162 | 0.3581 |
| 78 | 0.7992 | 0.4016 | 0.2008 |
| 79 | 0.7134 | 0.5733 | 0.2866 |
| 80 | 0.8102 | 0.3796 | 0.1898 |
| 81 | 0.7253 | 0.5494 | 0.2747 |
| 82 | 0.8205 | 0.359 | 0.1795 |
| 83 | 0.9969 | 0.006174 | 0.003087 |
| 84 | 0.9842 | 0.03163 | 0.01581 |
| Meta Analysis of Goldfeld-Quandt test for Heteroskedasticity | |||
| Description | # significant tests | % significant tests | OK/NOK |
| 1% type I error level | 1 | 0.0137 | NOK |
| 5% type I error level | 2 | 0.0273973 | OK |
| 10% type I error level | 2 | 0.0273973 | OK |
| Ramsey RESET F-Test for powers (2 and 3) of fitted values |
> reset_test_fitted RESET test data: mylm RESET = 1.7749, df1 = 2, df2 = 85, p-value = 0.1757 |
| Ramsey RESET F-Test for powers (2 and 3) of regressors |
> reset_test_regressors RESET test data: mylm RESET = 1.1593, df1 = 16, df2 = 71, p-value = 0.3215 |
| Ramsey RESET F-Test for powers (2 and 3) of principal components |
> reset_test_principal_components RESET test data: mylm RESET = 1.3781, df1 = 2, df2 = 85, p-value = 0.2576 |
| Variance Inflation Factors (Multicollinearity) |
> vif
    `^M`   `^M-1`   `^M-2`   `^M-3`    `^Gf`  `^Gf-1`  `^Gf-2`  `^Gf-3`
2.579924 4.645671 4.464674 2.517397 1.568928 1.860056 1.896317 1.557756
|