Free Statistics

of Irreproducible Research!

Author's title

Author*The author of this computation has been verified*
R Software Modulerwasp_correlation.wasp
Title produced by softwarePearson Correlation
Date of computationSat, 18 Apr 2020 04:32:18 +0200
Cite this page as followsStatistical Computations at FreeStatistics.org, Office for Research Development and Education, URL https://freestatistics.org/blog/index.php?v=date/2020/Apr/18/t1587177598n6j5x15tvmrjp4o.htm/, Retrieved Tue, 23 Apr 2024 08:06:34 +0200
Statistical Computations at FreeStatistics.org, Office for Research Development and Education, URL https://freestatistics.org/blog/index.php?pk=, Retrieved Tue, 23 Apr 2024 08:06:34 +0200
QR Codes:

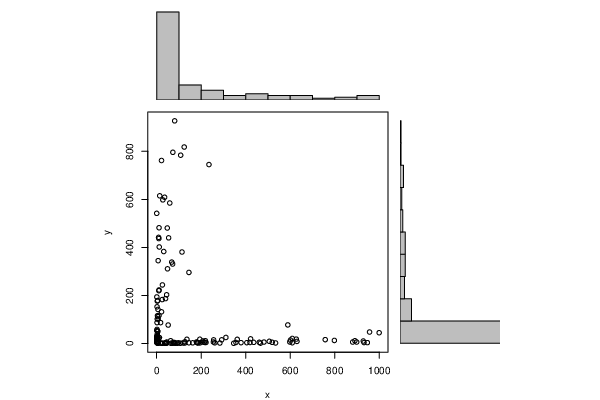
Original text written by user:I there correlation between number of tests performed per 1 million people and the number of COVID-19 cases per 1 million people?
IsPrivate?No (this computation is public)
User-defined keywordscorona virus, COVID-19 2020 April 18
Estimated Impact0
Dataseries X:
5,096
589
3,918
5,502
956
999
3,161
1,100
3,399
311
12,555
1,274
3,089
2,072
1,848
8,827
1,485
609
1,650
3,956
1,424
422
2,794
2,629
1,613
2,688
627
194
136
362
757
292
256
1,221
601
798
219
63
3,118
890
207
928
2,049
7
506
630
1,333
1,705
127
1,242
2,204
255
598
46
179
898
482
1,519
880
461
2,528
519
436
212
222
79
356
217
419

183
182
931
75
946
1,329
379
405

609
196
145
261
162
41
98
119
534
17
284
3
39
76
126
187
82
45
21
44
466
6
6
39
27
85
93
36
70
346
107
64
81
124
73
108
22
235
14
36
28
59
0.5
11
48
9
54
10
12
32
114
7
68
72
49
145
26
11
10
45
1
40
25
5
3
2
6
22
11
4
7
3
2
18
52
2
0.8
2
4
1.0
0.8
0.8
Dataseries Y:
111,955
77,550
52,239
50,577
47,932
45,035
39,368
28,340
27,307
25,348
24,933
24,664
23,849
23,605
21,678
21,653
21,634
21,314
20,629
19,896
19,570
19,506
19,490
19,095
18,795
18,358
18,344
17,950
17,579
17,409
16,203
15,429
15,354
15,024
14,409
12,920
11,773
11,615
11,588
11,586
10,659
10,499
10,306
9,442
9,187
8,970
8,863
8,634
7,436
7,387
7,212
6,510
6,508
6,349
6,311
6,231
6,168
6,152
6,144
5,149
5,114
5,002
4,910
4,871
4,793
4,566
4,494
4,467
4,460

4,309
4,305
4,137
4,008
3,808
3,802
3,684
3,642

3,373
3,275
3,235
3,132
2,988
2,988
2,811
2,663
2,441
2,167
2,144
2,119
2,009
1,928
1,844
1,765
1,737
1,637
1,632
1,603
1,580
1,511
1,463
1,440
1,429
1,402
1,260
1,225
1,179
1,127
1,077
1,024
927
818
796
784
762
745
615
609
598
585
542
482
481
442
440
437
402
383
381
345
339
331
311
296
244
223
220
203
194
187
183
179
177
153
142
132
117
116
102
102
87
87
77
59
54
32
32
27
19
18


Summary of computational transaction
Raw Input view raw input (R code)
Raw Outputview raw output of R engine
Computing time1 seconds
R ServerBig Analytics Cloud Computing Center
R Framework error message
Warning: there are blank lines in the 'Data X' field.
Please, use NA for missing data - blank lines are simply
 deleted and are NOT treated as missing values.

\begin{tabular}{lllllllll}
\hline
Summary of computational transaction \tabularnewline
Raw Input view raw input (R code)  \tabularnewline
Raw Outputview raw output of R engine  \tabularnewline
Computing time1 seconds \tabularnewline
R ServerBig Analytics Cloud Computing Center \tabularnewline
R Framework error message & 
Warning: there are blank lines in the 'Data X' field.
Please, use NA for missing data - blank lines are simply
 deleted and are NOT treated as missing values.
\tabularnewline \hline \end{tabular} %Source: https://freestatistics.org/blog/index.php?pk=&T=0

[TABLE]
[ROW]
Summary of computational transaction[/C][/ROW] [ROW]Raw Input[/C] view raw input (R code) [/C][/ROW] [ROW]Raw Output[/C]view raw output of R engine [/C][/ROW] [ROW]Computing time[/C]1 seconds[/C][/ROW] [ROW]R Server[/C]Big Analytics Cloud Computing Center[/C][/ROW] [ROW]R Framework error message[/C][C]
Warning: there are blank lines in the 'Data X' field.
Please, use NA for missing data - blank lines are simply
 deleted and are NOT treated as missing values.
[/C][/ROW] [/TABLE] Source: https://freestatistics.org/blog/index.php?pk=&T=0

Globally Unique Identifier (entire table): ba.freestatistics.org/blog/index.php?pk=&T=0

As an alternative you can also use a QR Code:  

The GUIDs for individual cells are displayed in the table below:

Summary of computational transaction
Raw Input view raw input (R code)
Raw Outputview raw output of R engine
Computing time1 seconds
R ServerBig Analytics Cloud Computing Center
R Framework error message
Warning: there are blank lines in the 'Data X' field.
Please, use NA for missing data - blank lines are simply
 deleted and are NOT treated as missing values.


Pearson Product Moment Correlation - Ungrouped Data
StatisticVariable XVariable Y
Mean170.341056603774109.183647798742
Biased Variance63325.346099122639853.9231578508
Biased Standard Deviation251.645278316766199.63447387125
Covariance-11159.3837570116
Correlation-0.220737362846188
Determination0.0487249833562898
T-Test-2.83578062159703
p-value (2 sided)0.005173862633871
p-value (1 sided)0.0025869313169355
95% CI of Correlation[-0.363882601254513, -0.0674060331882645]
Degrees of Freedom157
Number of Observations159

\begin{tabular}{lllllllll}
\hline
Pearson Product Moment Correlation - Ungrouped Data \tabularnewline
Statistic & Variable X & Variable Y \tabularnewline
Mean & 170.341056603774 & 109.183647798742 \tabularnewline
Biased Variance & 63325.3460991226 & 39853.9231578508 \tabularnewline
Biased Standard Deviation & 251.645278316766 & 199.63447387125 \tabularnewline
Covariance & -11159.3837570116 \tabularnewline
Correlation & -0.220737362846188 \tabularnewline
Determination & 0.0487249833562898 \tabularnewline
T-Test & -2.83578062159703 \tabularnewline
p-value (2 sided) & 0.005173862633871 \tabularnewline
p-value (1 sided) & 0.0025869313169355 \tabularnewline
95% CI of Correlation & [-0.363882601254513, -0.0674060331882645] \tabularnewline
Degrees of Freedom & 157 \tabularnewline
Number of Observations & 159 \tabularnewline
\hline
\end{tabular}
%Source: https://freestatistics.org/blog/index.php?pk=&T=1

[TABLE]
[ROW][C]Pearson Product Moment Correlation - Ungrouped Data[/C][/ROW]
[ROW][C]Statistic[/C][C]Variable X[/C][C]Variable Y[/C][/ROW]
[ROW][C]Mean[/C][C]170.341056603774[/C][C]109.183647798742[/C][/ROW]
[ROW][C]Biased Variance[/C][C]63325.3460991226[/C][C]39853.9231578508[/C][/ROW]
[ROW][C]Biased Standard Deviation[/C][C]251.645278316766[/C][C]199.63447387125[/C][/ROW]
[ROW][C]Covariance[/C][C]-11159.3837570116[/C][/ROW]
[ROW][C]Correlation[/C][C]-0.220737362846188[/C][/ROW]
[ROW][C]Determination[/C][C]0.0487249833562898[/C][/ROW]
[ROW][C]T-Test[/C][C]-2.83578062159703[/C][/ROW]
[ROW][C]p-value (2 sided)[/C][C]0.005173862633871[/C][/ROW]
[ROW][C]p-value (1 sided)[/C][C]0.0025869313169355[/C][/ROW]
[ROW][C]95% CI of Correlation[/C][C][-0.363882601254513, -0.0674060331882645][/C][/ROW]
[ROW][C]Degrees of Freedom[/C][C]157[/C][/ROW]
[ROW][C]Number of Observations[/C][C]159[/C][/ROW]
[/TABLE]
Source: https://freestatistics.org/blog/index.php?pk=&T=1

Globally Unique Identifier (entire table): ba.freestatistics.org/blog/index.php?pk=&T=1

As an alternative you can also use a QR Code:  

The GUIDs for individual cells are displayed in the table below:

Pearson Product Moment Correlation - Ungrouped Data
StatisticVariable XVariable Y
Mean170.341056603774109.183647798742
Biased Variance63325.346099122639853.9231578508
Biased Standard Deviation251.645278316766199.63447387125
Covariance-11159.3837570116
Correlation-0.220737362846188
Determination0.0487249833562898
T-Test-2.83578062159703
p-value (2 sided)0.005173862633871
p-value (1 sided)0.0025869313169355
95% CI of Correlation[-0.363882601254513, -0.0674060331882645]
Degrees of Freedom157
Number of Observations159


Normality Tests
> jarque.x
	Jarque-Bera Normality Test
data:  x
JB = 118.26, p-value < 2.2e-16
alternative hypothesis: greater
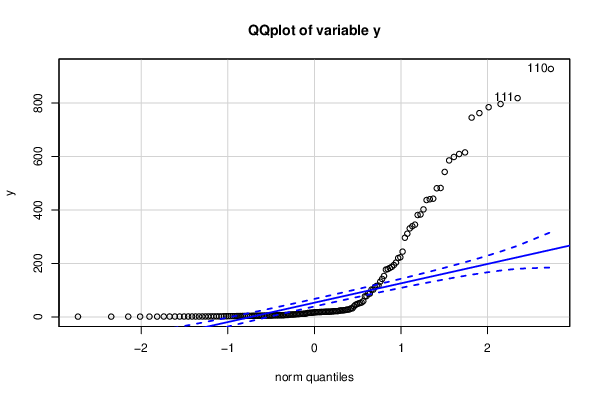
> jarque.y
	Jarque-Bera Normality Test
data:  y
JB = 261.79, p-value < 2.2e-16
alternative hypothesis: greater
> ad.x
	Anderson-Darling normality test
data:  x
A = 17.876, p-value < 2.2e-16
> ad.y
	Anderson-Darling normality test
data:  y
A = 26.455, p-value < 2.2e-16

\begin{tabular}{lllllllll}
\hline
Normality Tests \tabularnewline
> jarque.x
	Jarque-Bera Normality Test
data:  x
JB = 118.26, p-value < 2.2e-16
alternative hypothesis: greater
\tabularnewline
> jarque.y
	Jarque-Bera Normality Test
data:  y
JB = 261.79, p-value < 2.2e-16
alternative hypothesis: greater
\tabularnewline
> ad.x
	Anderson-Darling normality test
data:  x
A = 17.876, p-value < 2.2e-16
\tabularnewline
> ad.y
	Anderson-Darling normality test
data:  y
A = 26.455, p-value < 2.2e-16
\tabularnewline \hline \end{tabular} %Source: https://freestatistics.org/blog/index.php?pk=&T=2

[TABLE]
[ROW][C]Normality Tests[/C][/ROW]
[ROW][C]
> jarque.x
	Jarque-Bera Normality Test
data:  x
JB = 118.26, p-value < 2.2e-16
alternative hypothesis: greater
[/C][/ROW] [ROW][C]
> jarque.y
	Jarque-Bera Normality Test
data:  y
JB = 261.79, p-value < 2.2e-16
alternative hypothesis: greater
[/C][/ROW] [ROW][C]
> ad.x
	Anderson-Darling normality test
data:  x
A = 17.876, p-value < 2.2e-16
[/C][/ROW] [ROW][C]
> ad.y
	Anderson-Darling normality test
data:  y
A = 26.455, p-value < 2.2e-16
[/C][/ROW] [/TABLE] Source: https://freestatistics.org/blog/index.php?pk=&T=2

Globally Unique Identifier (entire table): ba.freestatistics.org/blog/index.php?pk=&T=2

As an alternative you can also use a QR Code:  

The GUIDs for individual cells are displayed in the table below:

Normality Tests
> jarque.x
	Jarque-Bera Normality Test
data:  x
JB = 118.26, p-value < 2.2e-16
alternative hypothesis: greater
> jarque.y
	Jarque-Bera Normality Test
data:  y
JB = 261.79, p-value < 2.2e-16
alternative hypothesis: greater
> ad.x
	Anderson-Darling normality test
data:  x
A = 17.876, p-value < 2.2e-16
> ad.y
	Anderson-Darling normality test
data:  y
A = 26.455, p-value < 2.2e-16


Parameters (Session):
Parameters (R input):
R code (references can be found in the software module):
library(psychometric)
x <- x[!is.na(y)]
y <- y[!is.na(y)]
y <- y[!is.na(x)]
x <- x[!is.na(x)]
bitmap(file='test1.png')
histx <- hist(x, plot=FALSE)
histy <- hist(y, plot=FALSE)
maxcounts <- max(c(histx$counts, histx$counts))
xrange <- c(min(x),max(x))
yrange <- c(min(y),max(y))
nf <- layout(matrix(c(2,0,1,3),2,2,byrow=TRUE), c(3,1), c(1,3), TRUE)
par(mar=c(4,4,1,1))
plot(x, y, xlim=xrange, ylim=yrange, xlab=xlab, ylab=ylab, sub=main)
par(mar=c(0,4,1,1))
barplot(histx$counts, axes=FALSE, ylim=c(0, maxcounts), space=0)
par(mar=c(4,0,1,1))
barplot(histy$counts, axes=FALSE, xlim=c(0, maxcounts), space=0, horiz=TRUE)
dev.off()
lx = length(x)
makebiased = (lx-1)/lx
varx = var(x)*makebiased
vary = var(y)*makebiased
corxy <- cor.test(x,y,method='pearson', na.rm = T)
cxy <- as.matrix(corxy$estimate)[1,1]
load(file='createtable')
a<-table.start()
a<-table.row.start(a)
a<-table.element(a,'Pearson Product Moment Correlation - Ungrouped Data',3,TRUE)
a<-table.row.end(a)
a<-table.row.start(a)
a<-table.element(a,'Statistic',1,TRUE)
a<-table.element(a,'Variable X',1,TRUE)
a<-table.element(a,'Variable Y',1,TRUE)
a<-table.row.end(a)
a<-table.row.start(a)
a<-table.element(a,'Mean',header=TRUE)
a<-table.element(a,mean(x))
a<-table.element(a,mean(y))
a<-table.row.end(a)
a<-table.row.start(a)
a<-table.element(a,'Biased Variance',header=TRUE)
a<-table.element(a,varx)
a<-table.element(a,vary)
a<-table.row.end(a)
a<-table.row.start(a)
a<-table.element(a,'Biased Standard Deviation',header=TRUE)
a<-table.element(a,sqrt(varx))
a<-table.element(a,sqrt(vary))
a<-table.row.end(a)
a<-table.row.start(a)
a<-table.element(a,'Covariance',header=TRUE)
a<-table.element(a,cov(x,y),2)
a<-table.row.end(a)
a<-table.row.start(a)
a<-table.element(a,'Correlation',header=TRUE)
a<-table.element(a,cxy,2)
a<-table.row.end(a)
a<-table.row.start(a)
a<-table.element(a,'Determination',header=TRUE)
a<-table.element(a,cxy*cxy,2)
a<-table.row.end(a)
a<-table.row.start(a)
a<-table.element(a,'T-Test',header=TRUE)
a<-table.element(a,as.matrix(corxy$statistic)[1,1],2)
a<-table.row.end(a)
a<-table.row.start(a)
a<-table.element(a,'p-value (2 sided)',header=TRUE)
a<-table.element(a,(p2 <- as.matrix(corxy$p.value)[1,1]),2)
a<-table.row.end(a)
a<-table.row.start(a)
a<-table.element(a,'p-value (1 sided)',header=TRUE)
a<-table.element(a,p2/2,2)
a<-table.row.end(a)
a<-table.row.start(a)
a<-table.element(a,'95% CI of Correlation',header=TRUE)
a<-table.element(a,paste('[',CIr(r=cxy, n = lx, level = .95)[1],', ', CIr(r=cxy, n = lx, level = .95)[2],']',sep=''),2)
a<-table.row.end(a)
a<-table.row.start(a)
a<-table.element(a,'Degrees of Freedom',header=TRUE)
a<-table.element(a,lx-2,2)
a<-table.row.end(a)
a<-table.row.start(a)
a<-table.element(a,'Number of Observations',header=TRUE)
a<-table.element(a,lx,2)
a<-table.row.end(a)
a<-table.end(a)
table.save(a,file='mytable.tab')
library(moments)
library(nortest)
jarque.x <- jarque.test(x)
jarque.y <- jarque.test(y)
if(lx>7) {
ad.x <- ad.test(x)
ad.y <- ad.test(y)
}
a<-table.start()
a<-table.row.start(a)
a<-table.element(a,'Normality Tests',1,TRUE)
a<-table.row.end(a)
a<-table.row.start(a)
a<-table.element(a,paste('
',RC.texteval('jarque.x'),'
',sep=''))
a<-table.row.end(a)
a<-table.row.start(a)
a<-table.element(a,paste('
',RC.texteval('jarque.y'),'
',sep=''))
a<-table.row.end(a)
if(lx>7) {
a<-table.row.start(a)
a<-table.element(a,paste('
',RC.texteval('ad.x'),'
',sep=''))
a<-table.row.end(a)
a<-table.row.start(a)
a<-table.element(a,paste('
',RC.texteval('ad.y'),'
',sep=''))
a<-table.row.end(a)
}
a<-table.end(a)
table.save(a,file='mytable1.tab')
library(car)
bitmap(file='test2.png')
qqPlot(x,main='QQplot of variable x')
dev.off()
bitmap(file='test3.png')
qqPlot(y,main='QQplot of variable y')
dev.off()