| Pearson Product Moment Correlation - Ungrouped Data | ||
| Statistic | Variable X | Variable Y |
| Mean | 170.341056603774 | 109.183647798742 |
| Biased Variance | 63325.3460991226 | 39853.9231578508 |
| Biased Standard Deviation | 251.645278316766 | 199.63447387125 |
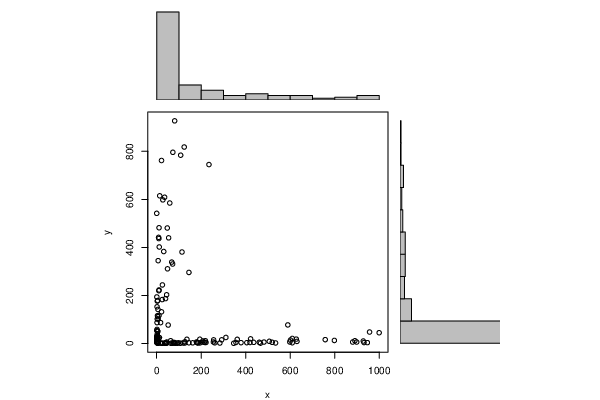
| Covariance | -11159.3837570116 | |
| Correlation | -0.220737362846188 | |
| Determination | 0.0487249833562898 | |
| T-Test | -2.83578062159703 | |
| p-value (2 sided) | 0.005173862633871 | |
| p-value (1 sided) | 0.0025869313169355 | |
| 95% CI of Correlation | [-0.363882601254513, -0.0674060331882645] | |
| Degrees of Freedom | 157 | |
| Number of Observations | 159 | |
| Normality Tests |
> jarque.x Jarque-Bera Normality Test data: x JB = 118.26, p-value < 2.2e-16 alternative hypothesis: greater |
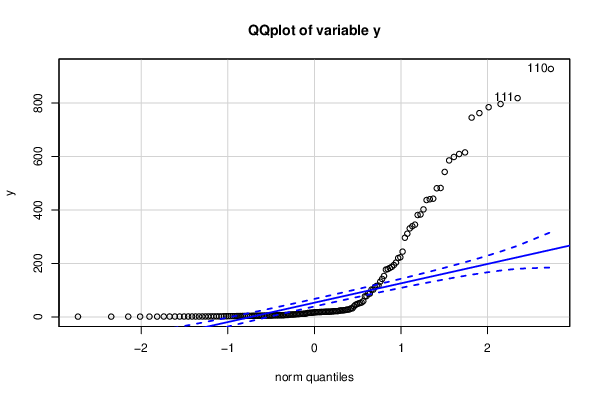
> jarque.y Jarque-Bera Normality Test data: y JB = 261.79, p-value < 2.2e-16 alternative hypothesis: greater |
> ad.x Anderson-Darling normality test data: x A = 17.876, p-value < 2.2e-16 |
> ad.y Anderson-Darling normality test data: y A = 26.455, p-value < 2.2e-16 |