| Pearson Product Moment Correlation - Ungrouped Data | ||
| Statistic | Variable X | Variable Y |
| Mean | 0.0958870782352941 | 0.0567219000588235 |
| Biased Variance | 0.0185539137599407 | 0.00549261963369122 |
| Biased Standard Deviation | 0.13621275182574 | 0.0741122097477279 |
| Covariance | 0.00848902230729525 | |
| Correlation | 0.791445851097491 | |
| Determination | 0.626386535219432 | |
| T-Test | 5.01482262479981 | |
| p-value (2 sided) | 0.000153887611020665 | |
| p-value (1 sided) | 7.69438055103324e-05 | |
| 95% CI of Correlation | [0.50161918167496, 0.92153480808692] | |
| Degrees of Freedom | 15 | |
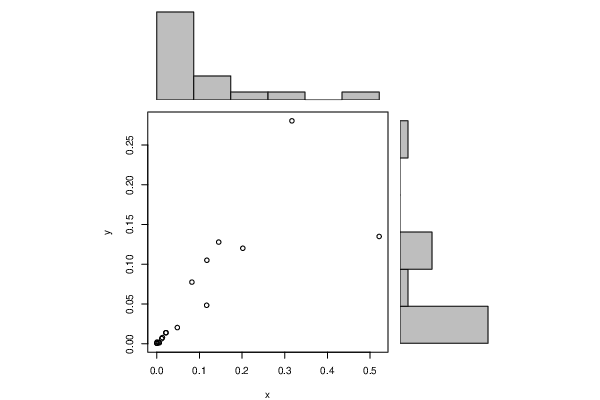
| Number of Observations | 17 | |
| Normality Tests |
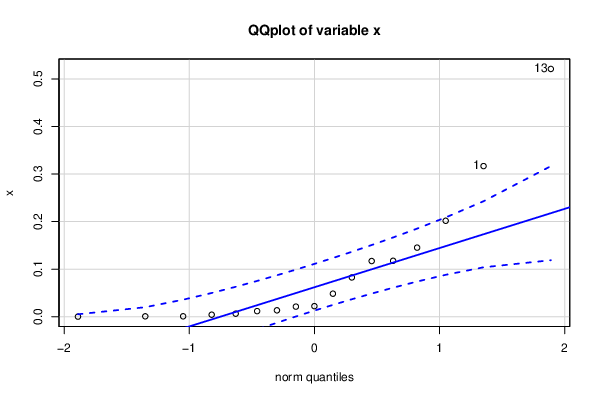
> jarque.x Jarque-Bera Normality Test data: x JB = 17.406, p-value = 0.000166 alternative hypothesis: greater |
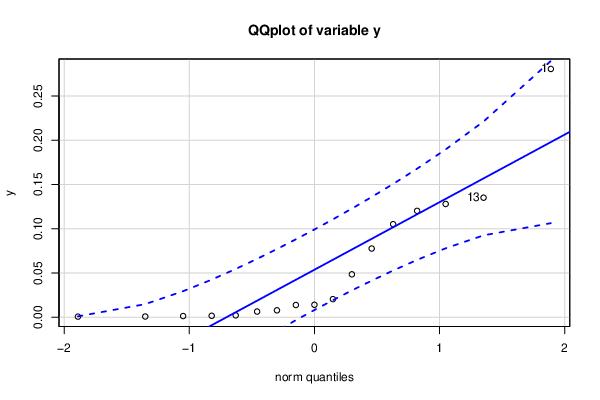
> jarque.y Jarque-Bera Normality Test data: y JB = 10.699, p-value = 0.004749 alternative hypothesis: greater |
> ad.x Anderson-Darling normality test data: x A = 1.7318, p-value = 0.000118 |
> ad.y Anderson-Darling normality test data: y A = 1.5048, p-value = 0.0004543 |