| Pearson Product Moment Correlation - Ungrouped Data | ||
| Statistic | Variable X | Variable Y |
| Mean | 97.2650602409639 | 4.27228915662651 |
| Biased Variance | 14.8357671650457 | 74.0005574103644 |
| Biased Standard Deviation | 3.85172262306695 | 8.60235766580095 |
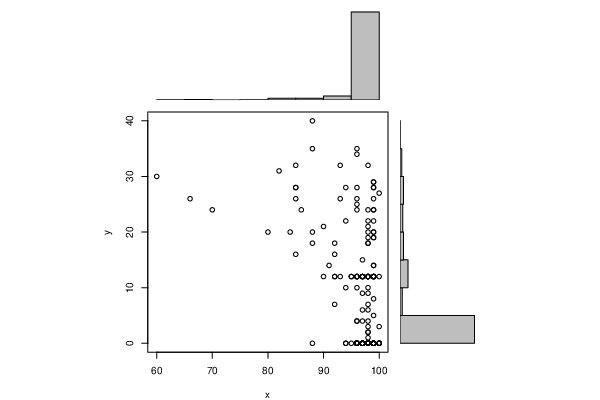
| Covariance | -17.1689657179442 | |
| Correlation | -0.516920645428577 | |
| Determination | 0.267206953670297 | |
| T-Test | -12.271799017667 | |
| p-value (2 sided) | 9.91061600650595e-30 | |
| p-value (1 sided) | 4.95530800325298e-30 | |
| 95% CI of Correlation | [-0.584116756134733, -0.442687055342169] | |
| Degrees of Freedom | 413 | |
| Number of Observations | 415 | |
| Normality Tests |
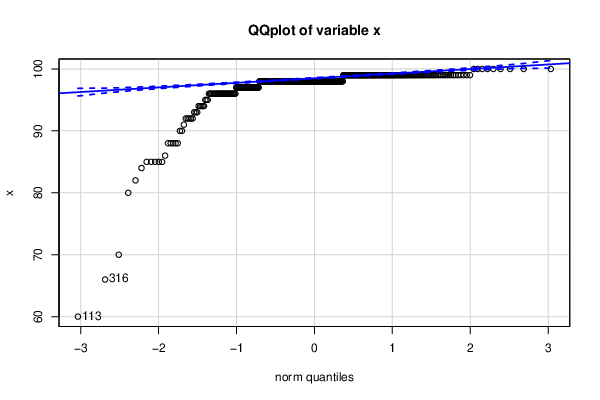
> jarque.x Jarque-Bera Normality Test data: x JB = 27702, p-value < 2.2e-16 alternative hypothesis: greater |
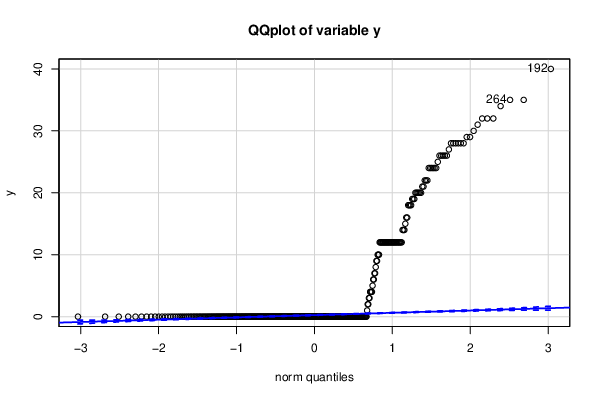
> jarque.y Jarque-Bera Normality Test data: y JB = 420.16, p-value < 2.2e-16 alternative hypothesis: greater |
> ad.x Anderson-Darling normality test data: x A = 72.033, p-value < 2.2e-16 |
> ad.y Anderson-Darling normality test data: y A = 84.213, p-value < 2.2e-16 |