| Pearson Product Moment Correlation - Ungrouped Data | ||
| Statistic | Variable X | Variable Y |
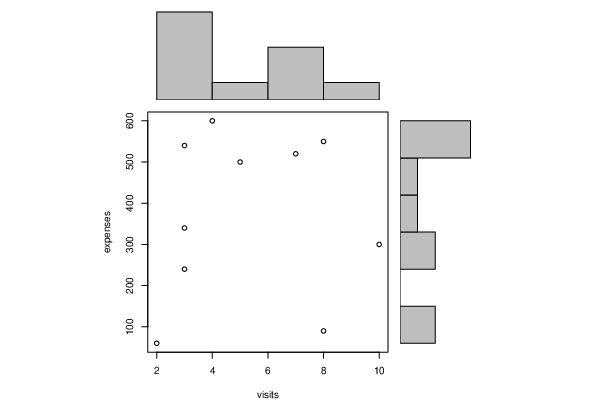
| Mean | 5.3 | 374 |
| Biased Variance | 6.81 | 35064 |
| Biased Standard Deviation | 2.60959767013998 | 187.253838411927 |
| Covariance | 35.3333333333333 | |
| Correlation | 0.0650762973974341 | |
| Determination | 0.00423492448295929 | |
| T-Test | 0.184454554684186 | |
| p-value (2 sided) | 0.858246929283576 | |
| p-value (1 sided) | 0.429123464641788 | |
| 95% CI of Correlation | [-0.588670020276625, 0.667358421738631] | |
| Degrees of Freedom | 8 | |
| Number of Observations | 10 | |
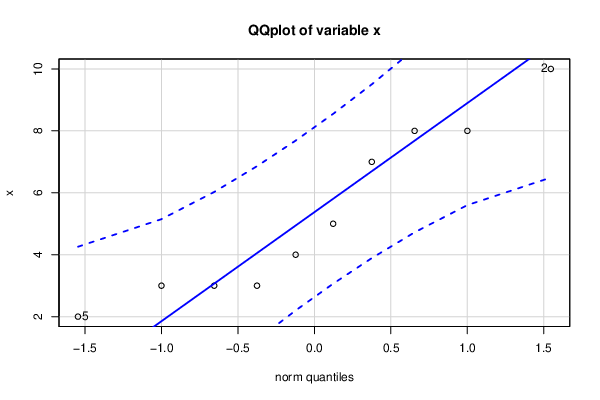
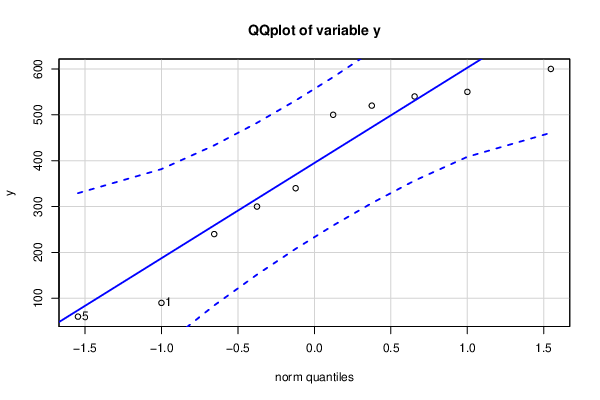
| Normality Tests |
> jarque.x Jarque-Bera Normality Test data: x JB = 0.9437, p-value = 0.6238 alternative hypothesis: greater |
> jarque.y Jarque-Bera Normality Test data: y JB = 0.99147, p-value = 0.6091 alternative hypothesis: greater |
> ad.x Anderson-Darling normality test data: x A = 0.47254, p-value = 0.1878 |
> ad.y Anderson-Darling normality test data: y A = 0.47077, p-value = 0.1898 |