| Pearson Product Moment Correlation - Ungrouped Data | ||
| Statistic | Variable X | Variable Y |
| Mean | 47.1674011111111 | 8.65033333333333 |
| Biased Variance | 75.0782552060099 | 6.39437733333333 |
| Biased Standard Deviation | 8.66477092634363 | 2.52871060687722 |
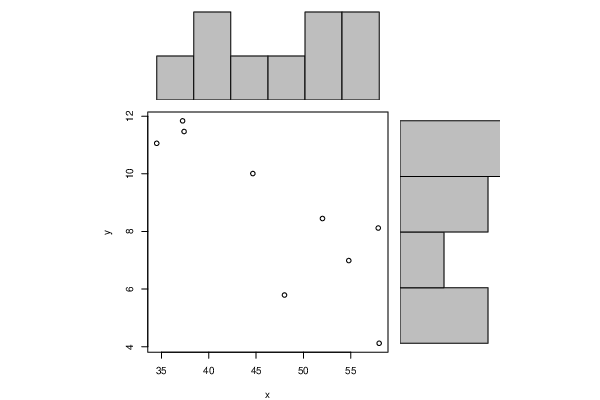
| Covariance | -20.4922106254167 | |
| Correlation | -0.831342671556705 | |
| Determination | 0.69113063755104 | |
| T-Test | -3.95768911947631 | |
| p-value (2 sided) | 0.00547783703995375 | |
| p-value (1 sided) | 0.00273891851997687 | |
| 95% CI of Correlation | [-0.963502434533842, -0.373355014074716] | |
| Degrees of Freedom | 7 | |
| Number of Observations | 9 | |
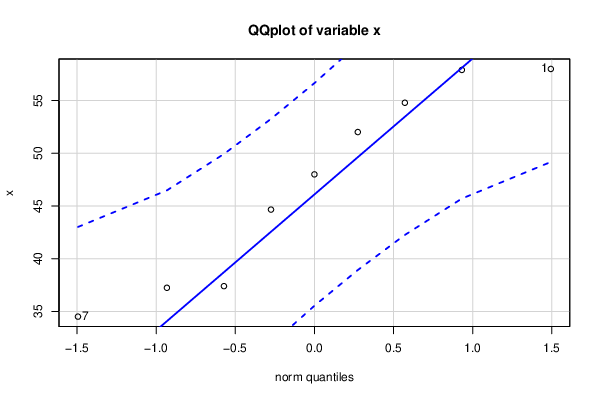
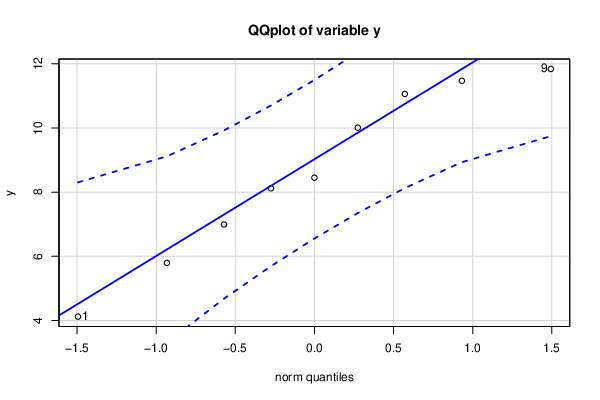
| Normality Tests |
> jarque.x Jarque-Bera Normality Test data: x JB = 0.88966, p-value = 0.6409 alternative hypothesis: greater |
> jarque.y Jarque-Bera Normality Test data: y JB = 0.62759, p-value = 0.7307 alternative hypothesis: greater |
> ad.x Anderson-Darling normality test data: x A = 0.3587, p-value = 0.3653 |
> ad.y Anderson-Darling normality test data: y A = 0.2284, p-value = 0.7322 |