Free Statistics

of Irreproducible Research!

Author's title

Author*Unverified author*
R Software Modulerwasp_hierarchicalclustering.wasp
Title produced by softwareHierarchical Clustering
Date of computationThu, 10 Dec 2020 18:23:55 +0100
Cite this page as followsStatistical Computations at FreeStatistics.org, Office for Research Development and Education, URL https://freestatistics.org/blog/index.php?v=date/2020/Dec/10/t1607623906ar66eh1t9hwjp4a.htm/, Retrieved Thu, 18 Apr 2024 20:14:01 +0200
Statistical Computations at FreeStatistics.org, Office for Research Development and Education, URL https://freestatistics.org/blog/index.php?pk=, Retrieved Thu, 18 Apr 2024 20:14:01 +0200
QR Codes:

Original text written by user:
IsPrivate?This computation is private
User-defined keywords
Estimated Impact0
Dataseries X:
-0.35	-0.76	-0.57	-0.69
-0.16	0.48	0.00	-0.02
-0.19	-0.53	-0.35	-0.56
-0.19	-0.84	0.28	0.55
-0.12	0.15	0.26	0.29
-0.04	0.70	-0.13	-0.47
0.53	0.10	-0.39	-1.19
-0.19	1.72	0.09	0.22
-0.30	0.13	1.33	3.46
-0.55	-1.30	-0.73	-0.52
-0.38	-1.50	-0.67	-0.86
-0.62	-1.00	-0.74	-0.06
-0.26	0.28	0.26	0.86
0.25	1.04	1.30	0.64
0.18	1.90	0.23	-0.35
2.22	1.74	0.43	-1.16
-0.62	0.34	-0.40	2.36
-0.56	-0.85	-0.58	0.24
-0.09	-0.60	-0.19	-0.49
-0.39	0.18	-0.65	-0.81
-0.34	-0.65	-0.30	-0.06
-0.57	-1.07	-0.71	-0.33
-0.35	-0.64	-0.51	-0.53
-0.53	-0.62	-0.70	-0.53
-0.59	1.18	-0.59	0.60
-0.61	-0.35	-0.46	1.74
-0.54	-0.94	-0.73	-0.60
-0.67	-0.70	-0.83	-0.24
4.39	1.24	3.58	-0.74
0.04	0.65	-0.24	-0.73
-0.06	-0.59	0.74	0.81
0.33	-0.89	-0.52	-1.23
1.87	2.30	2.98	-0.11
-0.55	-0.29	-0.52	0.50


Summary of computational transaction
Raw Input view raw input (R code)
Raw Outputview raw output of R engine
Computing time0 seconds
R ServerBig Analytics Cloud Computing Center

\begin{tabular}{lllllllll}
\hline
Summary of computational transaction \tabularnewline
Raw Input view raw input (R code)  \tabularnewline
Raw Outputview raw output of R engine  \tabularnewline
Computing time0 seconds \tabularnewline
R ServerBig Analytics Cloud Computing Center \tabularnewline
\hline
\end{tabular}
%Source: https://freestatistics.org/blog/index.php?pk=&T=0

[TABLE]
[ROW]
Summary of computational transaction[/C][/ROW] [ROW]Raw Input[/C] view raw input (R code) [/C][/ROW] [ROW]Raw Output[/C]view raw output of R engine [/C][/ROW] [ROW]Computing time[/C]0 seconds[/C][/ROW] [ROW]R Server[/C]Big Analytics Cloud Computing Center[/C][/ROW] [/TABLE] Source: https://freestatistics.org/blog/index.php?pk=&T=0

Globally Unique Identifier (entire table): ba.freestatistics.org/blog/index.php?pk=&T=0

As an alternative you can also use a QR Code:  

The GUIDs for individual cells are displayed in the table below:

Summary of computational transaction
Raw Input view raw input (R code)
Raw Outputview raw output of R engine
Computing time0 seconds
R ServerBig Analytics Cloud Computing Center


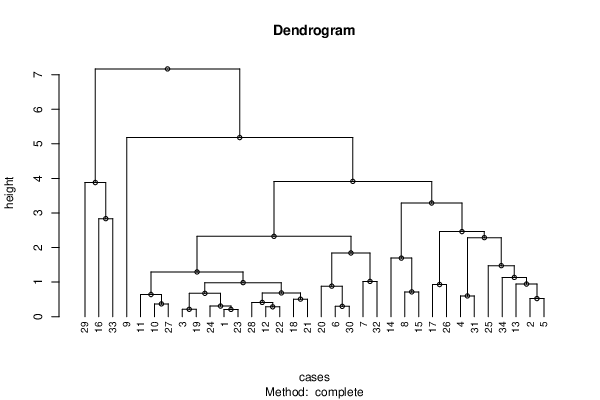
Summary of Dendrogram
LabelHeight
10.208806130178211
20.213072757526625
30.2849561369755
40.297657521322744
50.307408522978788
60.368917334913934
70.411582312545134
80.506754378372797
90.523641098463442
100.598832196863195
110.640624695121879
120.675055553269507
130.685784222623997
140.716798437498297
150.88255311454892
160.929623579735368
170.944457516249408
180.984073168011403
191.01911726508778
201.13393121484506
211.2934450123604
221.47560157224096
231.69395985784788
241.8424711666672
252.28621958700384
262.32363938682404
272.46081287382848
282.83568333916183
293.28855591407536
303.88043811959423
313.91380888649408
325.18226784332882
337.16662403088093

\begin{tabular}{lllllllll}
\hline
Summary of Dendrogram \tabularnewline
Label & Height \tabularnewline
1 & 0.208806130178211 \tabularnewline
2 & 0.213072757526625 \tabularnewline
3 & 0.2849561369755 \tabularnewline
4 & 0.297657521322744 \tabularnewline
5 & 0.307408522978788 \tabularnewline
6 & 0.368917334913934 \tabularnewline
7 & 0.411582312545134 \tabularnewline
8 & 0.506754378372797 \tabularnewline
9 & 0.523641098463442 \tabularnewline
10 & 0.598832196863195 \tabularnewline
11 & 0.640624695121879 \tabularnewline
12 & 0.675055553269507 \tabularnewline
13 & 0.685784222623997 \tabularnewline
14 & 0.716798437498297 \tabularnewline
15 & 0.88255311454892 \tabularnewline
16 & 0.929623579735368 \tabularnewline
17 & 0.944457516249408 \tabularnewline
18 & 0.984073168011403 \tabularnewline
19 & 1.01911726508778 \tabularnewline
20 & 1.13393121484506 \tabularnewline
21 & 1.2934450123604 \tabularnewline
22 & 1.47560157224096 \tabularnewline
23 & 1.69395985784788 \tabularnewline
24 & 1.8424711666672 \tabularnewline
25 & 2.28621958700384 \tabularnewline
26 & 2.32363938682404 \tabularnewline
27 & 2.46081287382848 \tabularnewline
28 & 2.83568333916183 \tabularnewline
29 & 3.28855591407536 \tabularnewline
30 & 3.88043811959423 \tabularnewline
31 & 3.91380888649408 \tabularnewline
32 & 5.18226784332882 \tabularnewline
33 & 7.16662403088093 \tabularnewline
\hline
\end{tabular}
%Source: https://freestatistics.org/blog/index.php?pk=&T=1

[TABLE]
[ROW][C]Summary of Dendrogram[/C][/ROW]
[ROW][C]Label[/C][C]Height[/C][/ROW]
[ROW][C]1[/C][C]0.208806130178211[/C][/ROW]
[ROW][C]2[/C][C]0.213072757526625[/C][/ROW]
[ROW][C]3[/C][C]0.2849561369755[/C][/ROW]
[ROW][C]4[/C][C]0.297657521322744[/C][/ROW]
[ROW][C]5[/C][C]0.307408522978788[/C][/ROW]
[ROW][C]6[/C][C]0.368917334913934[/C][/ROW]
[ROW][C]7[/C][C]0.411582312545134[/C][/ROW]
[ROW][C]8[/C][C]0.506754378372797[/C][/ROW]
[ROW][C]9[/C][C]0.523641098463442[/C][/ROW]
[ROW][C]10[/C][C]0.598832196863195[/C][/ROW]
[ROW][C]11[/C][C]0.640624695121879[/C][/ROW]
[ROW][C]12[/C][C]0.675055553269507[/C][/ROW]
[ROW][C]13[/C][C]0.685784222623997[/C][/ROW]
[ROW][C]14[/C][C]0.716798437498297[/C][/ROW]
[ROW][C]15[/C][C]0.88255311454892[/C][/ROW]
[ROW][C]16[/C][C]0.929623579735368[/C][/ROW]
[ROW][C]17[/C][C]0.944457516249408[/C][/ROW]
[ROW][C]18[/C][C]0.984073168011403[/C][/ROW]
[ROW][C]19[/C][C]1.01911726508778[/C][/ROW]
[ROW][C]20[/C][C]1.13393121484506[/C][/ROW]
[ROW][C]21[/C][C]1.2934450123604[/C][/ROW]
[ROW][C]22[/C][C]1.47560157224096[/C][/ROW]
[ROW][C]23[/C][C]1.69395985784788[/C][/ROW]
[ROW][C]24[/C][C]1.8424711666672[/C][/ROW]
[ROW][C]25[/C][C]2.28621958700384[/C][/ROW]
[ROW][C]26[/C][C]2.32363938682404[/C][/ROW]
[ROW][C]27[/C][C]2.46081287382848[/C][/ROW]
[ROW][C]28[/C][C]2.83568333916183[/C][/ROW]
[ROW][C]29[/C][C]3.28855591407536[/C][/ROW]
[ROW][C]30[/C][C]3.88043811959423[/C][/ROW]
[ROW][C]31[/C][C]3.91380888649408[/C][/ROW]
[ROW][C]32[/C][C]5.18226784332882[/C][/ROW]
[ROW][C]33[/C][C]7.16662403088093[/C][/ROW]
[/TABLE]
Source: https://freestatistics.org/blog/index.php?pk=&T=1

Globally Unique Identifier (entire table): ba.freestatistics.org/blog/index.php?pk=&T=1

As an alternative you can also use a QR Code:  

The GUIDs for individual cells are displayed in the table below:

Summary of Dendrogram
LabelHeight
10.208806130178211
20.213072757526625
30.2849561369755
40.297657521322744
50.307408522978788
60.368917334913934
70.411582312545134
80.506754378372797
90.523641098463442
100.598832196863195
110.640624695121879
120.675055553269507
130.685784222623997
140.716798437498297
150.88255311454892
160.929623579735368
170.944457516249408
180.984073168011403
191.01911726508778
201.13393121484506
211.2934450123604
221.47560157224096
231.69395985784788
241.8424711666672
252.28621958700384
262.32363938682404
272.46081287382848
282.83568333916183
293.28855591407536
303.88043811959423
313.91380888649408
325.18226784332882
337.16662403088093


Parameters (Session):
par1 = complete ; par2 = ALL ; par3 = FALSE ; par4 = FALSE ;
Parameters (R input):
par1 = complete ; par2 = ALL ; par3 = FALSE ; par4 = FALSE ;
R code (references can be found in the software module):
par4 <- 'FALSE'
par3 <- 'FALSE'
par2 <- 'ALL'
par1 <- 'complete'
par3 <- as.logical(par3)
par4 <- as.logical(par4)
if (par3 == 'TRUE'){
dum = xlab
xlab = ylab
ylab = dum
}
x <- t(y)
hc <- hclust(dist(x),method=par1)
d <- as.dendrogram(hc)
str(d)
mysub <- paste('Method: ',par1)
bitmap(file='test1.png')
if (par4 == 'TRUE'){
plot(d,main=main,ylab=ylab,xlab=xlab,horiz=par3, nodePar=list(pch = c(1,NA), cex=0.8, lab.cex = 0.8),type='t',center=T, sub=mysub)
} else {
plot(d,main=main,ylab=ylab,xlab=xlab,horiz=par3, nodePar=list(pch = c(1,NA), cex=0.8, lab.cex = 0.8), sub=mysub)
}
dev.off()
if (par2 != 'ALL'){
if (par3 == 'TRUE'){
ylab = 'cluster'
} else {
xlab = 'cluster'
}
par2 <- as.numeric(par2)
memb <- cutree(hc, k = par2)
cent <- NULL
for(k in 1:par2){
cent <- rbind(cent, colMeans(x[memb == k, , drop = FALSE]))
}
hc1 <- hclust(dist(cent),method=par1, members = table(memb))
de <- as.dendrogram(hc1)
bitmap(file='test2.png')
if (par4 == 'TRUE'){
plot(de,main=main,ylab=ylab,xlab=xlab,horiz=par3, nodePar=list(pch = c(1,NA), cex=0.8, lab.cex = 0.8),type='t',center=T, sub=mysub)
} else {
plot(de,main=main,ylab=ylab,xlab=xlab,horiz=par3, nodePar=list(pch = c(1,NA), cex=0.8, lab.cex = 0.8), sub=mysub)
}
dev.off()
str(de)
}
load(file='createtable')
a<-table.start()
a<-table.row.start(a)
a<-table.element(a,'Summary of Dendrogram',2,TRUE)
a<-table.row.end(a)
a<-table.row.start(a)
a<-table.element(a,'Label',header=TRUE)
a<-table.element(a,'Height',header=TRUE)
a<-table.row.end(a)
num <- length(x[,1])-1
for (i in 1:num)
{
a<-table.row.start(a)
a<-table.element(a,hc$labels[i])
a<-table.element(a,hc$height[i])
a<-table.row.end(a)
}
a<-table.end(a)
table.save(a,file='mytable1.tab')
if (par2 != 'ALL'){
a<-table.start()
a<-table.row.start(a)
a<-table.element(a,'Summary of Cut Dendrogram',2,TRUE)
a<-table.row.end(a)
a<-table.row.start(a)
a<-table.element(a,'Label',header=TRUE)
a<-table.element(a,'Height',header=TRUE)
a<-table.row.end(a)
num <- par2-1
for (i in 1:num)
{
a<-table.row.start(a)
a<-table.element(a,i)
a<-table.element(a,hc1$height[i])
a<-table.row.end(a)
}
a<-table.end(a)
table.save(a,file='mytable2.tab')
}